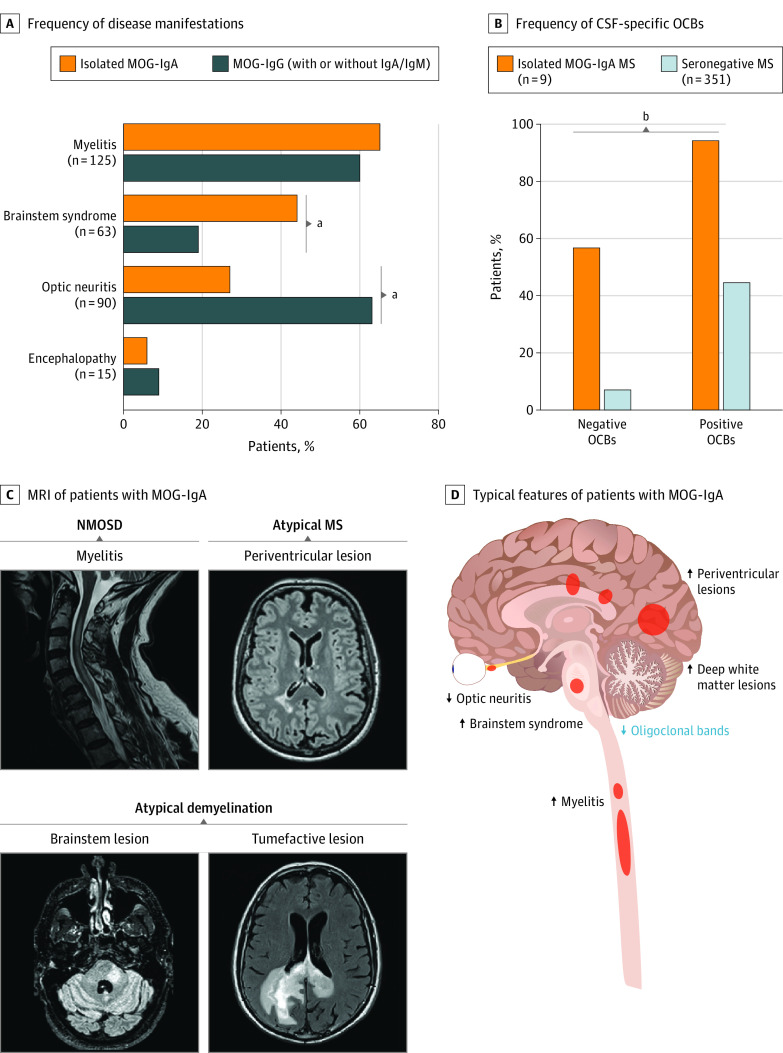
Figure 2. Clinical Characterization of Patients Seropositive for Myelin Oligodendrocyte Glycoprotein (MOG) Immunoglobulin (Ig) A.
A, Frequency of disease manifestations for patients with isolated MOG-IgA and MOG-IgG. B, Frequency of positive and negative cerebrospinal fluid (CSF)–specific oligoclonal bands (OCBs) in MOG-IgA seropositive multiple sclerosis (MS) compared with seronegative MS. C, Magnetic resonance imaging (MRI) of patients with MOG-IgA highlighting the following disease phenotypes: neuromyelitis optica spectrum disorder (NMOSD, often presenting with myelitis), atypical MS (often presenting with periventricular lesions), and atypical demyelination (often associated with brainstem syndrome or with tumor-mimic/atypical demyelination). D, Clinical features frequently observed in isolated MOG-IgA seropositive central nervous system demyelination. Arrows indicate high and low frequencies.
aFisher exact test, P < .05.
bFisher exact test, P < .001.

