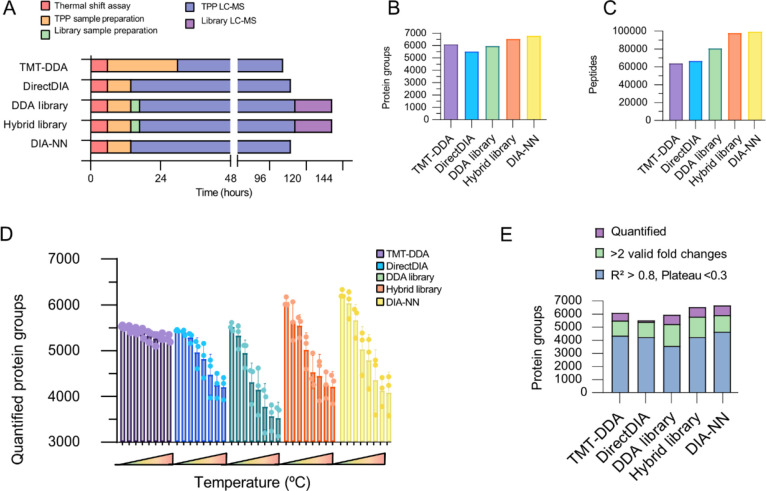
Figure 3.
Performance overview of quantitative approaches for thermal proteome profiling. (A) Bar plot showing the time required in hours for each method, comparing thermal shift assay (red), TPP-sample preparation (orange), library-sample preparation (green), instrument time for TPP-sample (blue), and library-sample (purple) analyses. (B) Proteins cumulative across all samples, (C) number of peptides identified, (D) average number of quantified proteins across three biological replicates in each temperature soluble fraction, and (E) average number of quantified proteins (purple), with two valid values for curve fitting (green) and of which sigmoidal curves were fit well (R2 > 0.8 and plateau <0.3) (blue).

