
Figure 1. Imaging findings in PCA-APS.
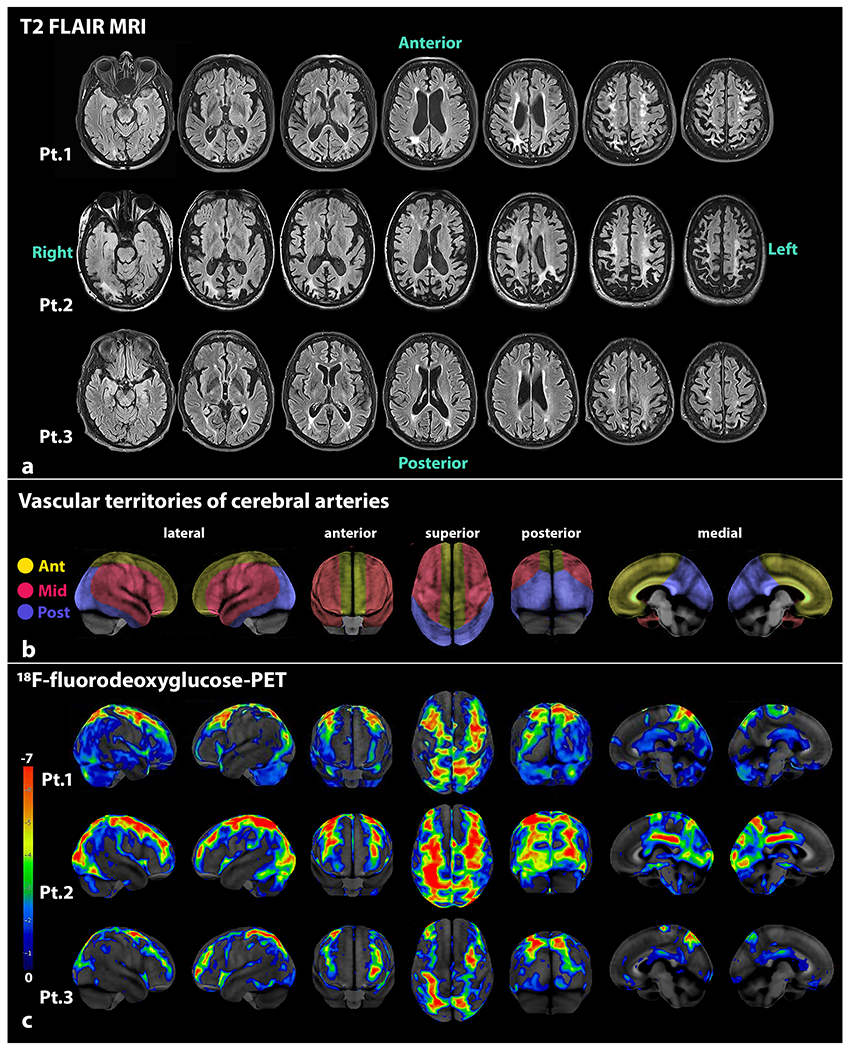
Serial T2 FLAIR MRI supratentorial sequences are shown from the three PCA-APS patients, where asymmetric bilateral atrophy involving the posterior parietal and occipital regions is seen in the top three rows (a). The frontal areas show relatively less atrophy. Multiple white matter lesions of variable sizes are seen in periventricular, deep, and subcortical white matter in watershed areas. The vascular territories supplied by the three main cerebral arteries (depicted in yellow for the anterior cerebral arteries, red for middle cerebral arteries, and blue for posterior cerebral arteries) are shown in the middle row (b). The pattern of glucose hypometabolism on 18F-fluorodeoxyglucose PET scans from the three PCA-APS patients are shown in the lower three rows (c). The PET images of each patient were processed with CortexID Suite. The “railroad track” sign is best appreciated in the superior views of the brain, where marked hypometabolism is observed in watershed regions where the anterior, middle, and posterior cerebral arteries converge. The posterior views of the brain also show the considerable hypometabolism in the posterior parietal and occipital lobes, with some patchy involvement of the visual cortices. Abbreviations: Ant = anterior cerebral artery; APS = antiphospholipid syndrome; FLAIR MRI = fluid attenuated inversion recovery magnetic resonance imaging; Mid = middle cerebral artery; PCA = posterior cortical atrophy; Post = posterior cerebral artery; Pt = patient