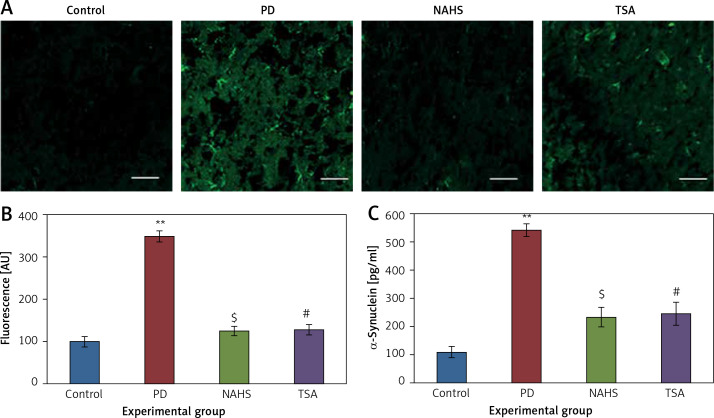
Figure 3.
A – Representative confocal microscopic image of Fluoro-Jade staining of control and experimental group of rats’ brain tissue. B – The fluorescence intensities were quantified and represented as arbitrary units (magnification 20×). C – The level of α-synuclein measured using ELISA is shown
Statistical significance expressed as *p < 0.05, **p < 0.01 compared to saline-treated controls, $p < 0.05 NAHS compared to PD rats; #p < 0.05 TSA compared to PD rats.

