
Figure 7.
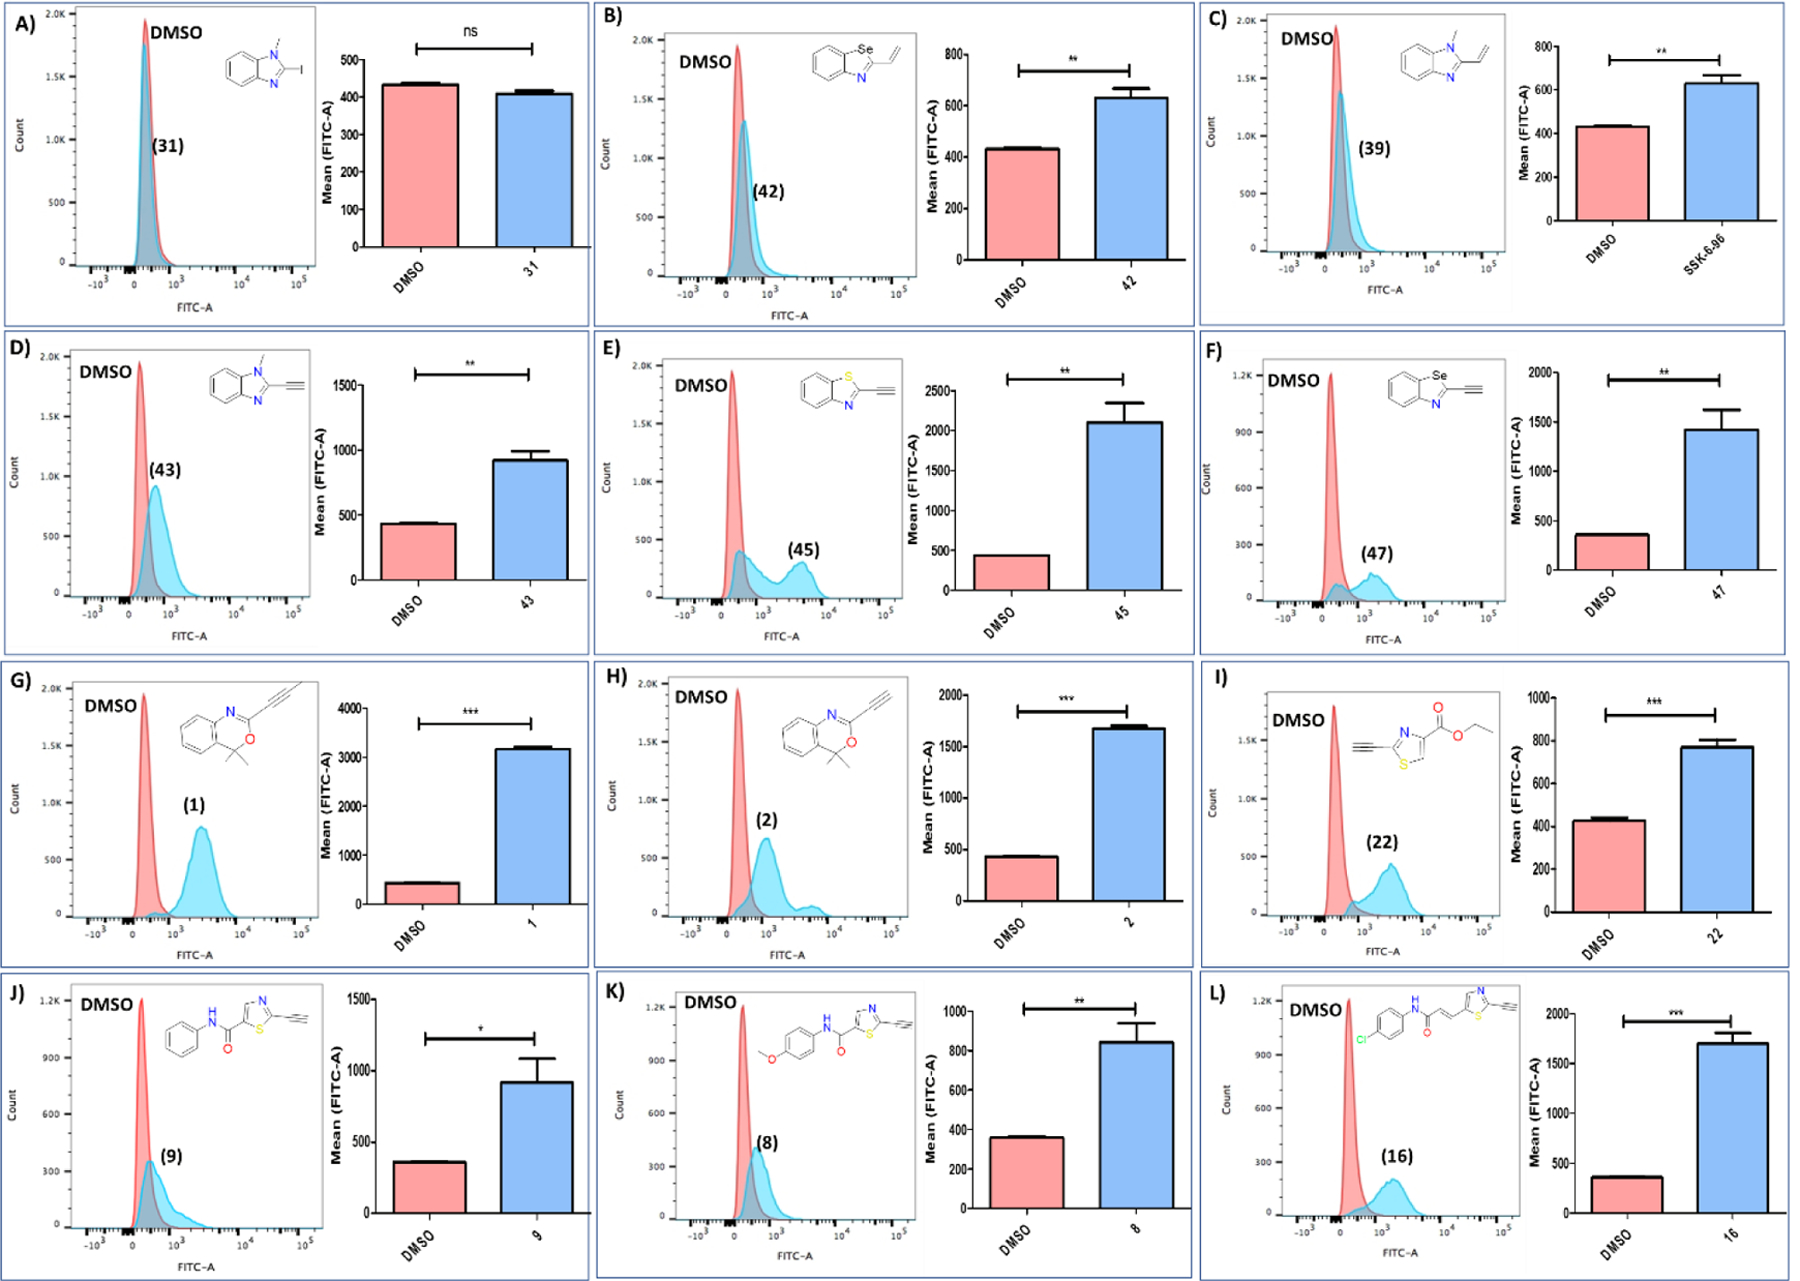
Lipid peroxide levels measured by flow cytometry using C11-BODIPY dye. (A) The benzimidazole iodo analog (31) does not increase levels of lipid peroxides. (B,C) The alkene analogs (39) and (42) 6 h after treatment marginally increase lipid peroxide levels. (D-L) The tested alkyne analogs led to significant increase of the lipid peroxides levels when compared to the corresponding DMSO treatment. The concentrations of the compounds used are: (31) (5 μM), (42) (60 μM), (39) (10 μM), (43) (40 μM), (45) (5 μM), (47) (10 μM), (1) (40 μM), (2) (5 μM), (22) (20 μM), (9) (5 μM), (8) (5 μM), (16) (5 μM). The treatment time for figures 9A–E and 9G-I is 6 h, while for figures 9F and 9J–L is 3h. Data are mean ± SD. (n = 3). Statistical analysis using t-test, *P < 0.05, **P < 0.01, ***P < 0.001.