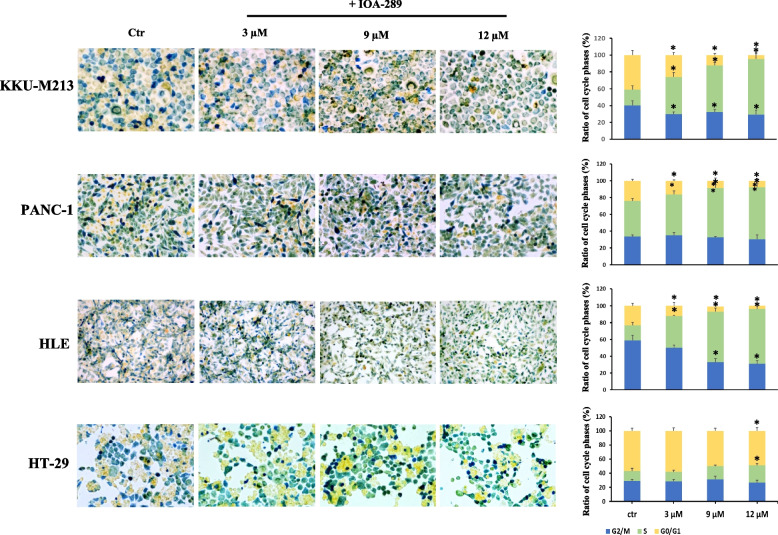
Fig. 7.
Analysis of changes in cell cycle phases during treatment with IOA-289. Cells from CRC, HCC, PC and CCA were cultured to a > 80% confluence and then treated with 3, 9 and 12 µM IOA-289 for 24 h. The different cell cycle phases were visualized by staining with Biocolor Cell-Clock™ Cell Cycle Assay. Following dye uptake and incubation a distinct color change occurs within cells, with particular color changes being associated with cells in the G0-G1(yellow), S (green), G2 and M Phases (blu). IOA-289 determines an arrest of the cell cycle in S phase, as can be observed particularly for KKU-M213, HLE and PANC-1 cells (*P < 0.05)

