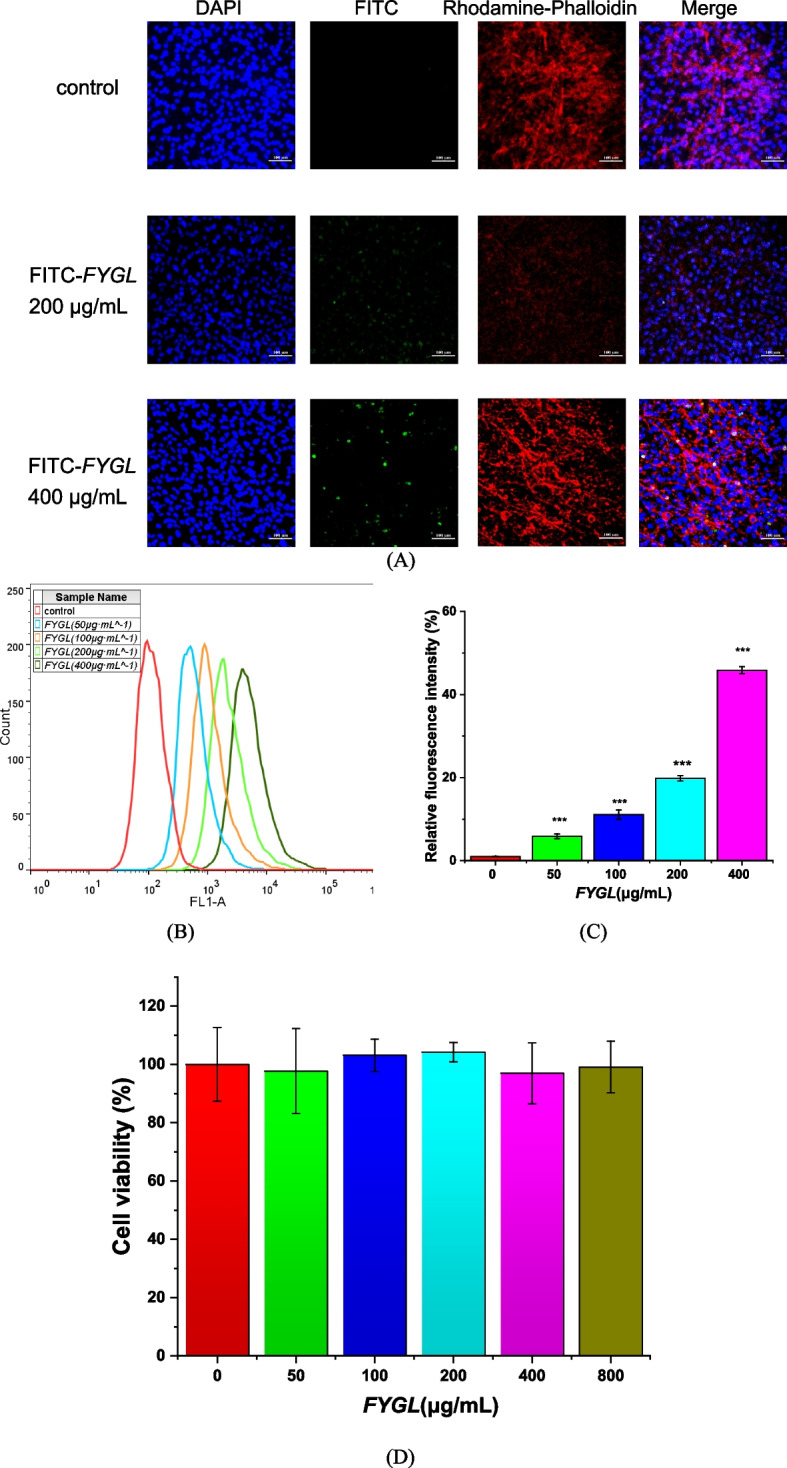
Fig. 6.

A Laser confocal scanning microscopy images of FYGL in 3T3-L1 cells at 200 × magnification. 3T3-L1 cells were incubated with FITC–FYGL (200 μg/mL) for 4 h; blue (DAPI labelled), red (rhodamine labelled) and green (FITC labelled) represent the nucleus, cytoskeleton and FYGL, respectively. The scale bar represents 100 μm. B Flow cytometric analysis of fluorescence. C Geometric means calculated by FlowJo software. The data are presented as the mean ± S.D. values (n = 3). ***P < 0.001 vs. control group. D Effect of FYGL on cell viability. 3T3-L1 cells were incubated with various concentrations of FYGL (0, 50, 100, 200, 400 and 800 μg·mL.−1) for 24 h, and cell viability was determined by a CCK-8 assay. The mean ± S.D. values are presented (n = 6)
