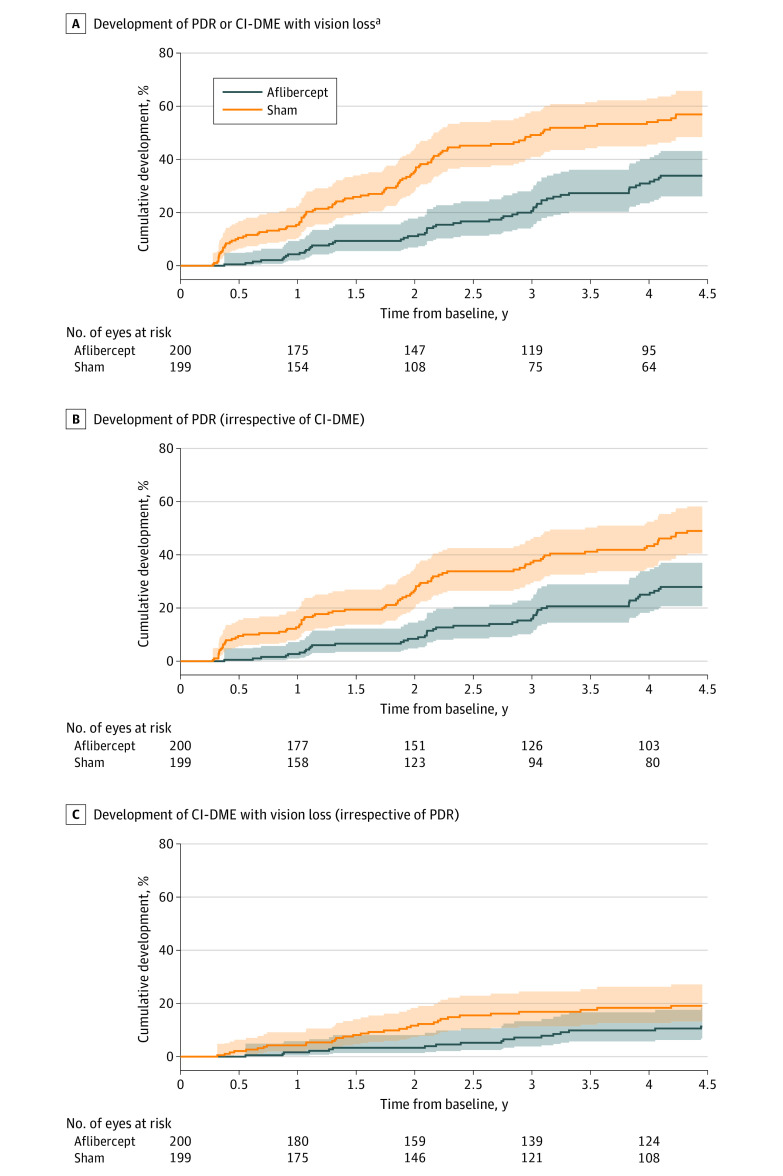
Figure 3. Cumulative Percentages for Time From Baseline to Development of PDR or CI-DME With Vision Loss, PDR, and CI-DME With Vision Loss.
Cumulative percentages were estimated using Kaplan-Meier (product-limit) method. Shading indicates 97.5% CIs. Median time from baseline to event or censoring time: for panel A, 1370 (IQR, 698 to 1465) days in the aflibercept group and 783 (IQR, 378 to 1428) days in the sham group; for panel B, 1411 (IQR, 740 to 1465) days in the aflibercept group and 1040 (IQR, 413 to 1457) days in the sham group; and for panel C, 1421 (IQR, 859 to 1474) days in the aflibercept group and 1408 (IQR, 707 to 1463) days in the sham group.
aIndicates proliferative diabetic retinopathy (PDR) or center-involved diabetic macular edema (CI-DME), whichever develops first.

