
Figure 2. Cumulative Conception and Live Birth Rates by Risk Score Levels.
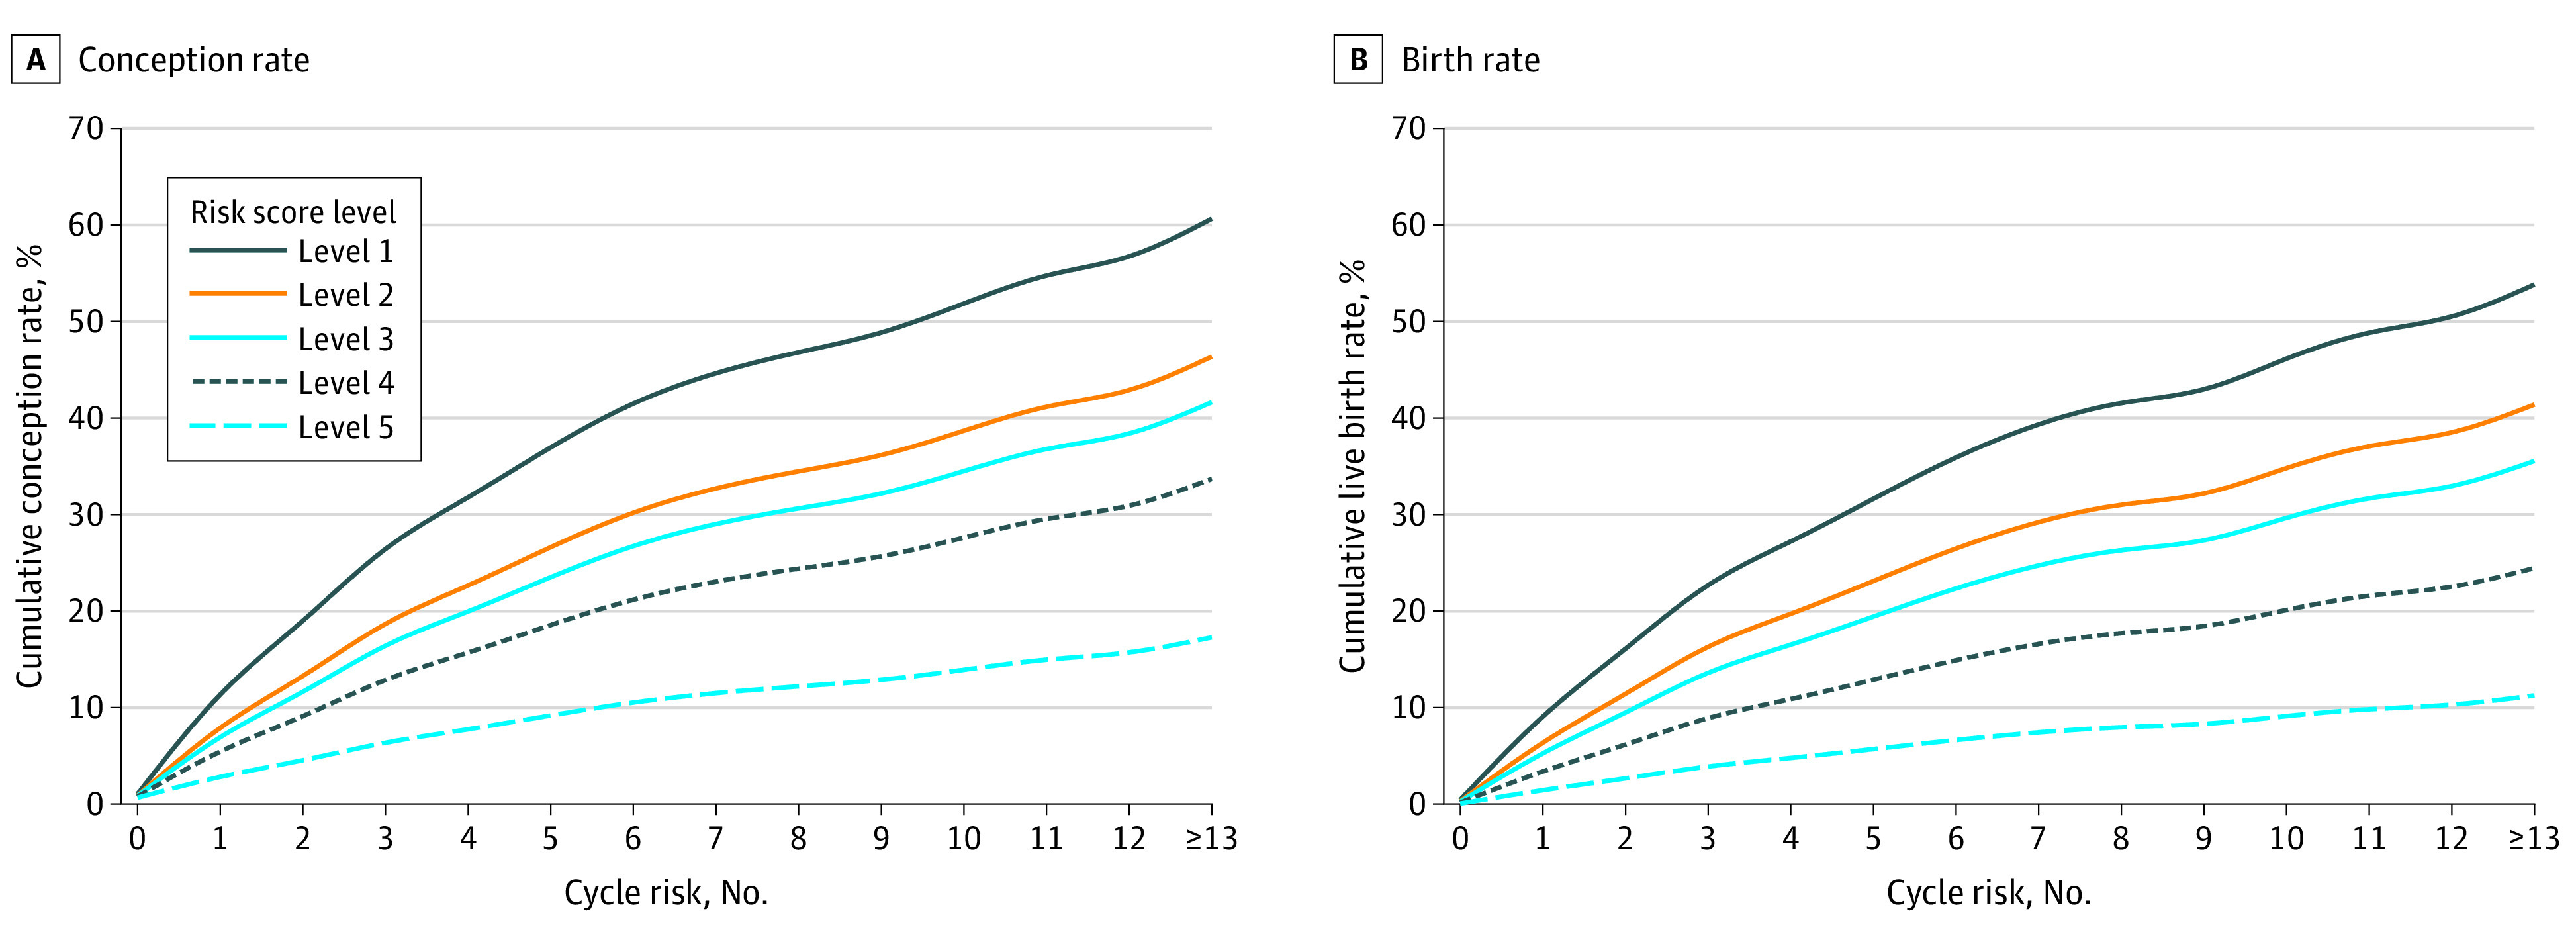
The cumulative percentages were estimated using the Kaplan-Meier method. The curves are adjusted for ethnicity, educational level, monthly household income, and parity.
Official websites use .gov
A
.gov website belongs to an official
government organization in the United States.
Secure .gov websites use HTTPS
A lock (
) or https:// means you've safely
connected to the .gov website. Share sensitive
information only on official, secure websites.
The cumulative percentages were estimated using the Kaplan-Meier method. The curves are adjusted for ethnicity, educational level, monthly household income, and parity.