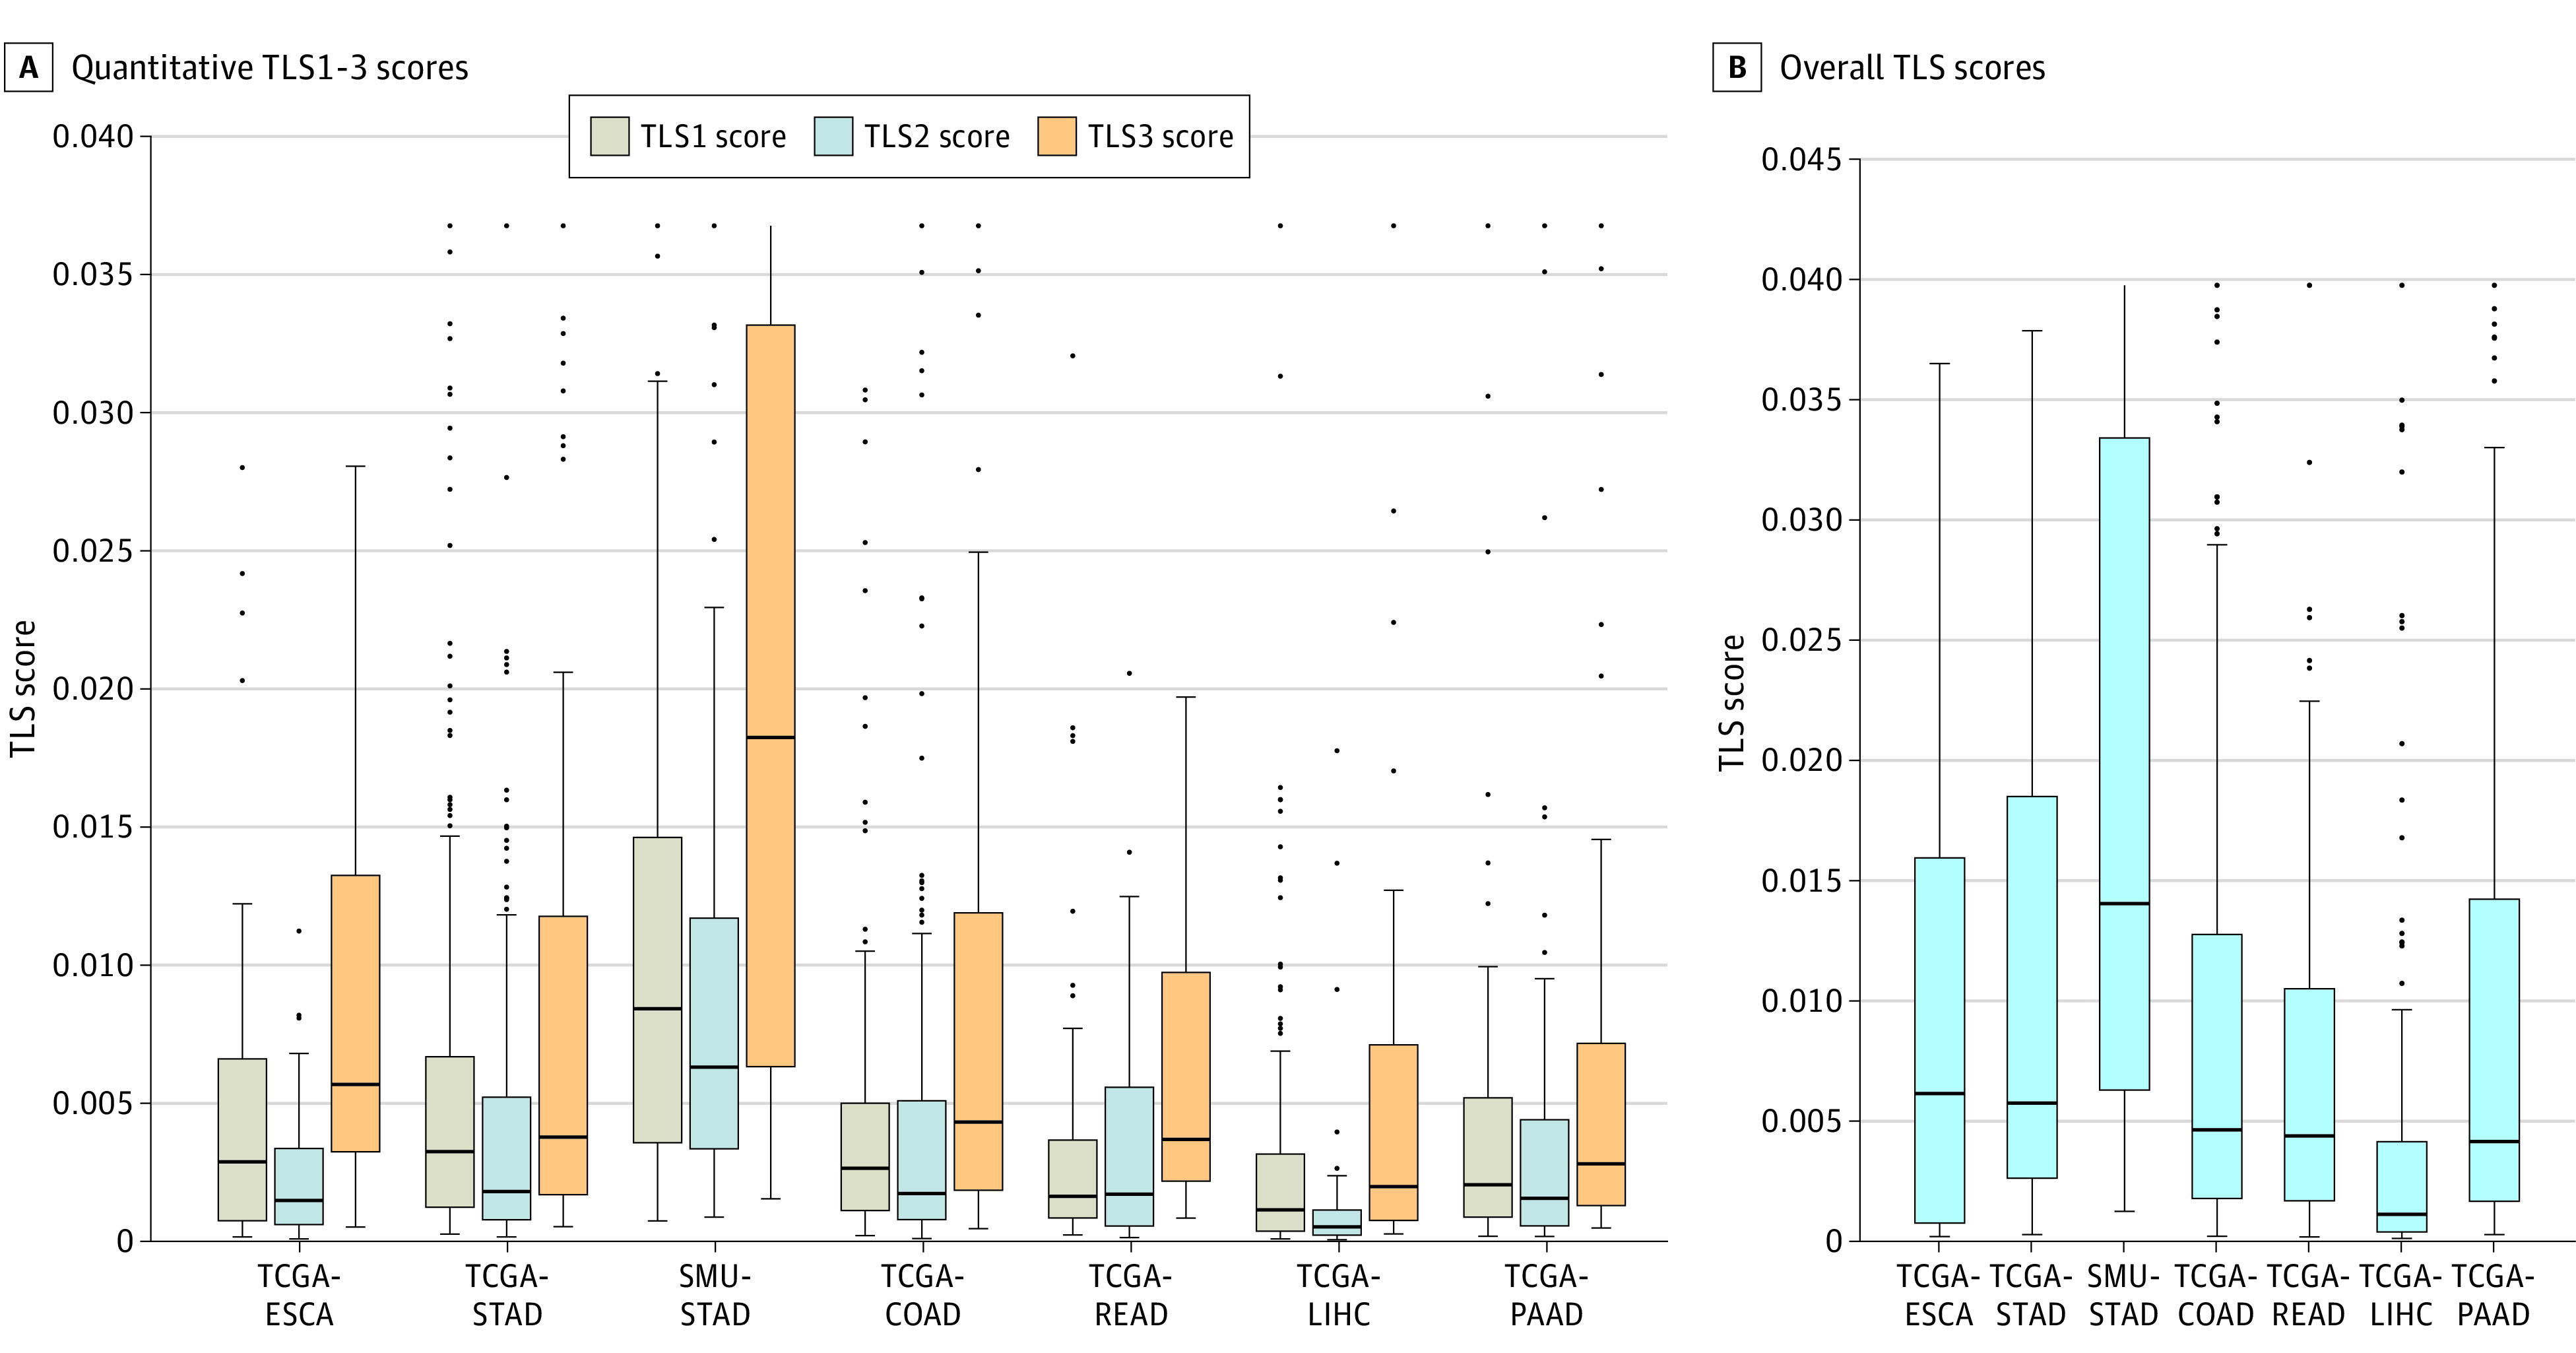
Figure 3. Distributions of Tertiary Lymphoid Structure (TLS) Scores.

The distributions of quantitative TLS1 through TLS3 scores and overall TLS score across 6 cancer types in 7 cohorts are shown. Boxes indicate first and third quartiles; COAD, colon adenocarcinoma; dots, outliers; ESCA, esophageal carcinoma; horizontal lines, medians; LIHC, liver hepatocellular carcinoma; PAAD, pancreatic adenocarcinoma; READ, rectum adenocarcinoma; SMU, Southern Medical University; STAD, stomach adenocarcinoma; TCGA, The Cancer Genome Atlas; whiskers, 1.5 × IQR.
