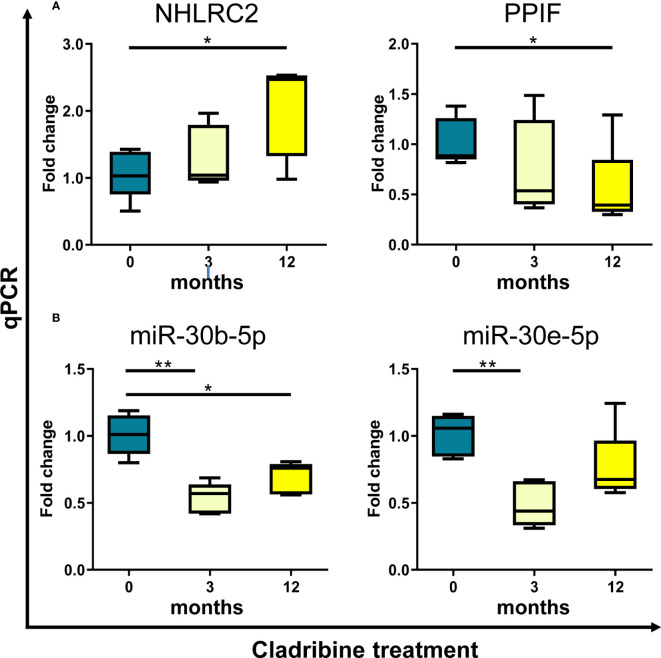
Figure 5.
Ex vivo validation of selected candidate biomarkers by qPCR. Expression levels of the genes NHLRC2 and PPIF (A), and the miRNAs miR-30b-5p and miR-30e-5p (B) were determined by qPCR in samples obtained from PBMCs of MS patients (N=5) treated with cladribine at baseline and after 3 and 12 months of treatment. Graphs are expressed as fold-change in gene and miRNA expression relative to baseline. *p-value <0.05, **p-value <0.01 (One-way ANOVA with repeated measures following a Dunnett multiple comparisons test, taking the baseline condition as reference). For the sake of clarity, only significant p-values are shown in the graphs. NHLRC2, NHL repeat containing 2. PPIF, Cyclophilin D.

