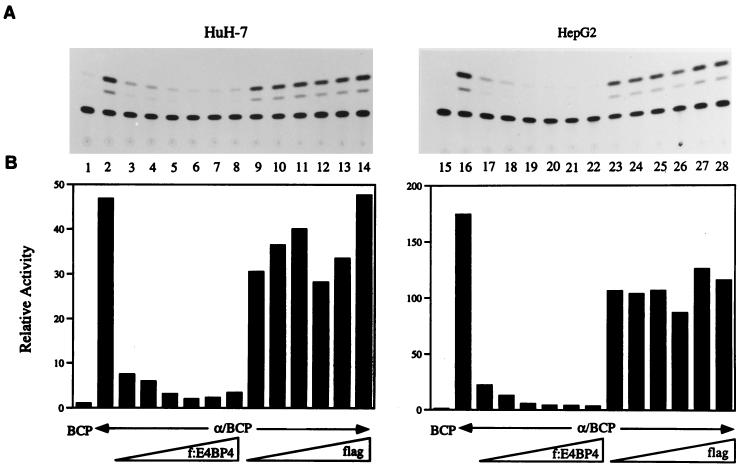
FIG. 3.
Repression of the box α activity by E4BP4. HuH-7 (lanes 1 to 14) and HepG2 (lanes 15 to 28) cells were transfected with 8 μg of pBCP-CAT only (lanes 1 and 15), 8 μg of pα/BCP-CAT only (lanes 2 and 16), 8 μg of pα/BCP-CAT plus 31.2, 62.5, 125, 250, 500, or 1,000 ng of pf:E4BP4 (lanes 3 to 8 and 17 to 22, respectively), or 8 μg of pα/BCP-CAT plus 31.2, 62.5, 125, 250, 500 or 1,000 ng of pFLAG-CMV2 (lanes 9 to 14 and 23 to 28, respectively). The cell densities for HuH-7 and HepG2 cells were 1.5 × 10⁶ and 2.8 × 10⁶ per 5-cm-diameter plate, respectively. The ability of a cotransfected expression vector to modulate the box α activity was determined by CAT assay. (A) Autoradiogram of CAT activities in a representative assay. (B) Diagram showing the suppression of CAT activity produced by pα/BCP-CAT in the presence of an increasing amount of cotransfected pf:E4BP4. The diagram shows the CAT activity exhibited by pα/BCP-CAT relative to that of pBCP-CAT. Results were quantitated by PhosphorImager counting as described in Materials and Methods.

