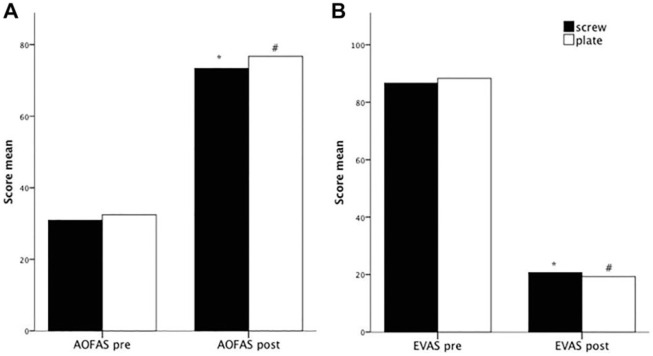
Figure 3.
Preoperative (pre) and postoperative (post) functional evaluation using (A) AOFAS and (B) VAS scores. In black are patients who received screw and in white, patients who received plate treatment. *P < .05 pre vs post for screw technique; #P < .05 pre vs post for plate technique. AOFAS, American Orthopaedic Foot & Ankle Society; VAS, visual analog scale.

