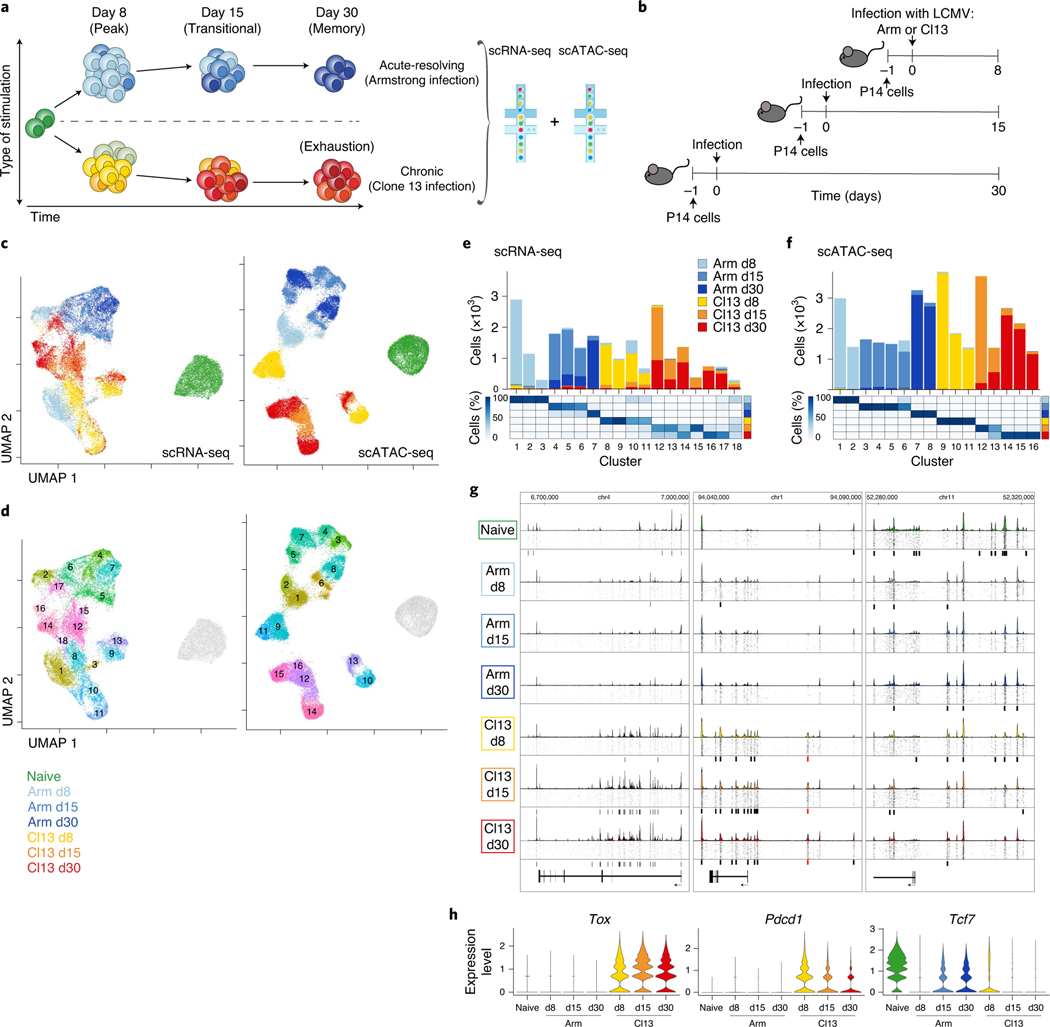
Fig. 1 |. Single-cell transcriptional and accessible chromatin landscape of memory and exhausted CD8+ T development.
a, Experimental strategy to capture CD8+ T cell differentiation in acute resolving and chronic viral infections. Microfluidic image provided by 10x Genomics. b, Detailed experimental schematic (Extended Data Fig. 1a). c,d, UMAP from scRNA-seq and scATAC-seq colored by infection and time point (c) or by cluster (d). e,f, Enumeration and proportion of cells per cluster as indicated for scRNA-seq (e) or scATAC-seq (f). g, scATAC-seq coverage and tile plots. Sample-specific ACRs are indicated with black boxes below tile plot. Previously identified Pdcd1 enhancer17 indicated in red. h, Gene expression from scRNA-seq of genes represented in g.

