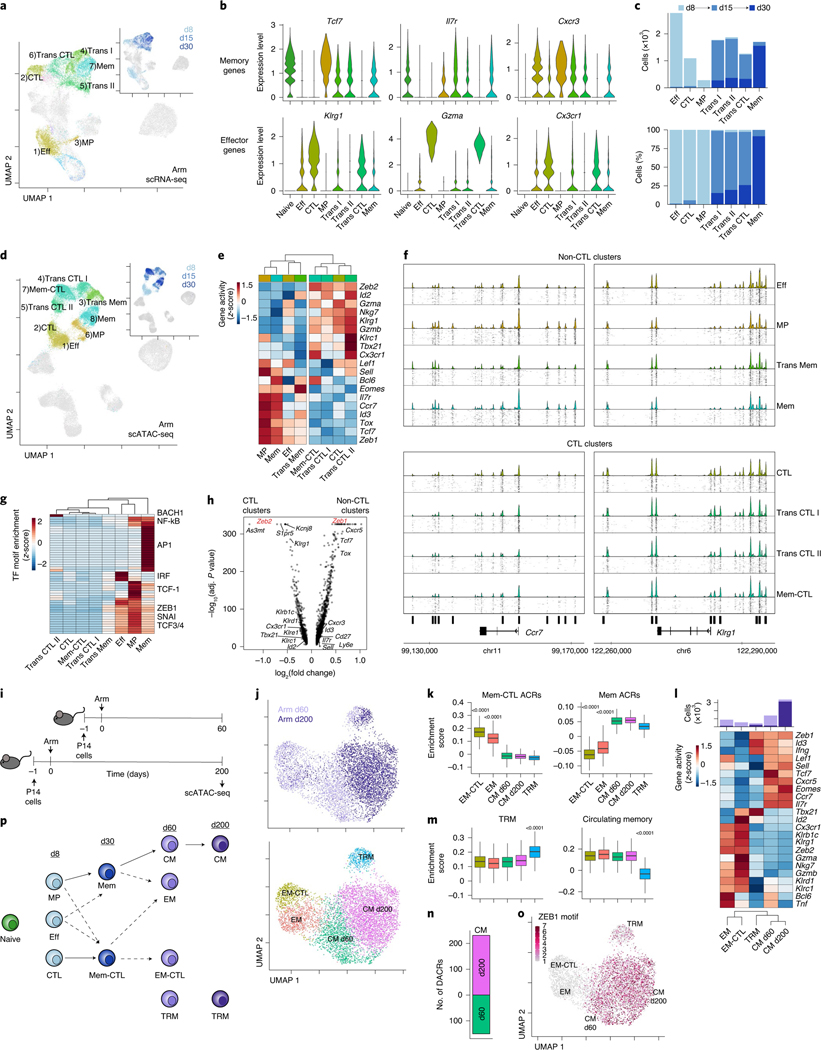
Fig. 2 |. Acute-resolving infection generates two branches of effector and memory CD8+ T cells distinguished by epigenetic cytolytic potential.
a, scRNA-seq UMAP; cells from Arm infection are colored by cluster or time point (inset). b, Expression of T cell genes by cluster. c, Number (top) and percentage (bottom) of cells from Arm infection per cluster filled by time point. d, scATAC-seq UMAP; cells from Arm infection are colored by cluster or time point (inset). e, Average gene activity per scATAC-seq cluster. f, scATAC-seq coverage and tile plots. DACRs of CTL versus non-CTL clusters indicated on the bottom. g, Average TF motif enrichment per scATAC-seq cluster of differentially enriched motifs comparing CTL and non-CTL scATAC-seq clusters. h, Differential gene activity comparing CTL and non-CTL scATAC-seq clusters. Gene loci of interest indicated. Calculation performed with two-sided Seurat FindMarkers LR test using Bonferroni correction. i, Experimental schematic of long-term Arm infection experiment (Extended Data Fig. 1b). j, scATAC-seq UMAP of cells from experiment in i colored by time point (top) or cluster (bottom). k, Enrichment score of cluster-specific ACRs from d30 Arm Mem-CTL and Mem scATAC-seq clusters. Two-sided Wilcoxon test of EM (871 cells) or EM-CTL (547 cells) versus the rest (5,741 or 6,065 cells). l, Average gene activity per scATAC-seq cluster with number of cells per cluster indicated on top, filled by time point. m, Enrichment score of gene activity from gene sets derived from TRM or circulating memory cells48. Two-sided Wilcoxon test of TRM (419 cells) versus the rest (6,193 cells). n, Number of DACRs between CM d60 and CM d200 clusters. DACRs were calculated with Signac FindAllMarkers two-sided likelihood-ratio (LR) test using Bonferroni correction. o, scATAC-seq UMAP of cells from experiment in i colored by ZEB1 motif enrichment. p, Data summary schematic. In box plots, the median is indicated by the center line; box limits represent upper and lower quartiles; and whiskers extend to 1.5 times the interquartile range.

