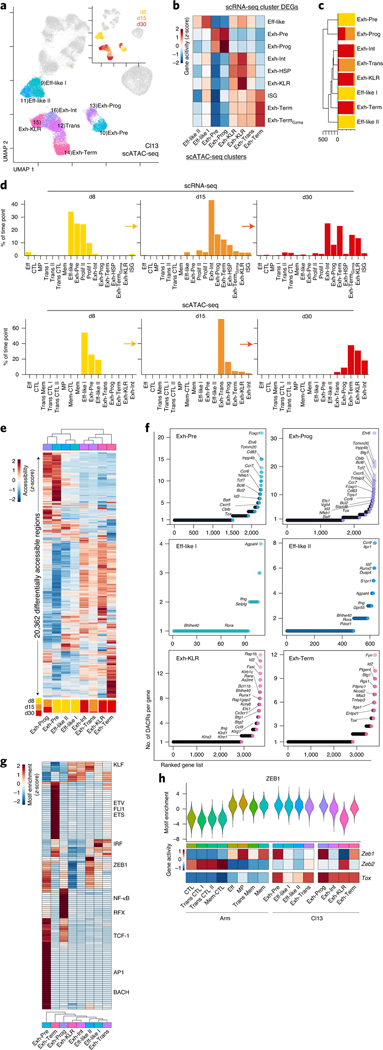
Fig. 4 |. The accessible chromatin landscape distinguishes fewer exhausted T cell epigenetic cell fates under wider transcriptional diversity.
a, scATAC-seq UMAP; cells from Cl13 infection are colored by cluster or time point (inset). b, Average enrichment score per scATAC-seq cluster of gene sets from scRNA-seq cluster DEGs, using gene activity. c, Phylogenetic tree of scATAC-seq clusters with proportion of cells per time point. d, Percentage of cells from Cl13 infection by time point as indicated in scRNA-seq clusters (top) and scATAC-seq clusters (bottom). e, Average accessibility of DACRs per scATAC-seq cluster with proportion of cells per time point in each cluster represented below. f, Number of DACRs per gene loci for each scATAC-seq cluster. DACRs were calculated with Signac FindAllMarkers two-sided LR test using Bonferroni correction. g, Average TF motif enrichment per cluster for differentially enriched TF motifs. h, Top, ZEB1 motif enrichment. Bottom, Zeb1, Zeb2 and Tox average gene activity per scATAC-seq cluster.

