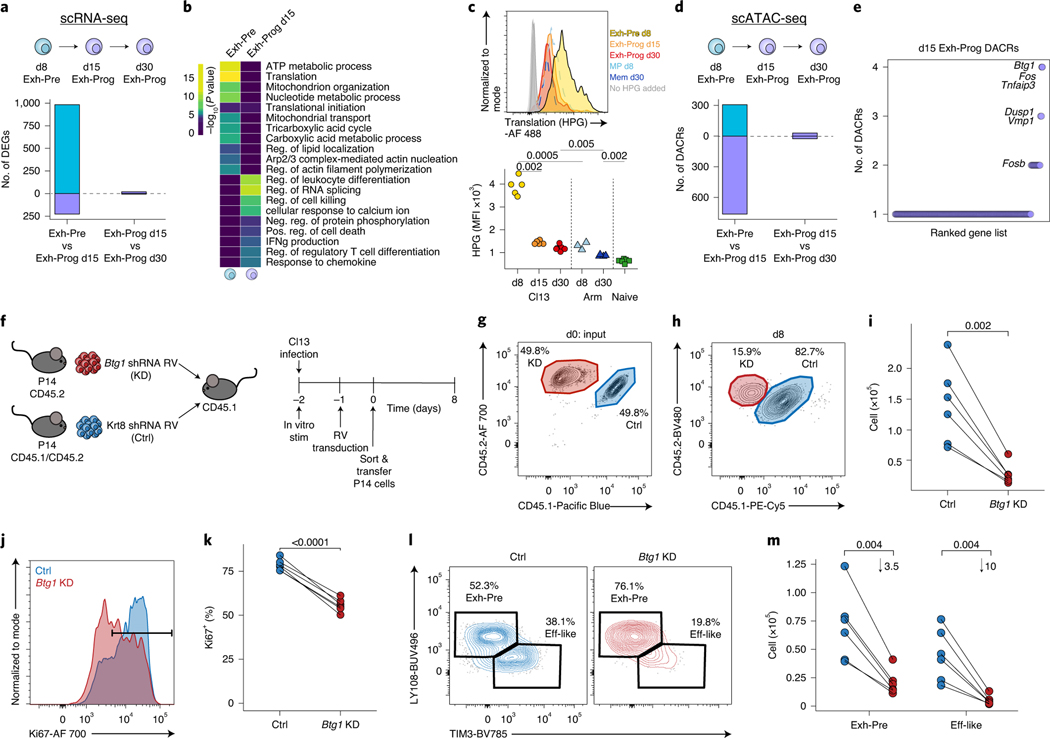
Fig. 8 |. Transition from Exh-Pre to Exh-Prog uncovers Btg1 as a new regulator of exhausted T cell differentiation.
a, Enumerated DEGs from pairwise analysis. DEGs were calculated with Seurat FindMarkers two-sided Wilcoxon test using Bonferroni correction. b, Gene Ontology of DEGs from a performed with Metascape, which uses a hypergeometric test and Benjamini–Hochberg P-value correction algorithm. c, Representative flow cytometry plot (top) and enumeration of MFI of HPG signal (bottom) from in vitro translation assay. Cells were gated as described in Fig. 3j. n = 5 d8 Cl13, n = 5 d15 Cl13, n = 6 d30 Cl13, n = 5 d8 Arm, n = 4 d30 Arm and n = 6 naive mice. Data are representative of two independent experiments. P values were calculated with two-sided Student’s t-test using Benjamini–Hochberg correction. d, Enumerated DACRs from pairwise analysis as indicated. DACRs were calculated with Signac FindAllMarkers two-sided LR test using Bonferroni correction. e, Number of DACRs in d15 Exh-Prog per gene loci. Select genes overlapping with d15 Exh-Prog DEGs are annotated. f, Experimental schematic. g, Flow cytometry plot of input P14 cell mixture containing Btg1 KD and Ctrl. h, Representative flow cytometry plot from d8 p.i. Cells were gated on RV+ (GFP) live CD8+ P14 T cells (Extended Data Fig. 1g). Mean percentage is indicated. i, Total P14 cells with Btg1 KD or Ctrl RV. P values were calculated with two-sided paired Student’s t-test. j, Representative flow cytometry plot of Ki67 staining; histograms were colored by shRNA target. k, Total Ki67+ cells per shRNA target as indicated. P values were calculated with two-sided paired Student’s t-test. l, Representative flow cytometry plots of Tex subsets. Cells gated on RV+ live P14 T cells. Mean percentage as indicated. m, Total RV+ live P14 T cells per each subset. Mean fold change is indicated. P values were calculated with two-sided paired Student’s t-test with Benjamini–Hochberg correction. In h–m, n = 6 mice. Each point represents a mouse. Data are representative of three independent experiments.

