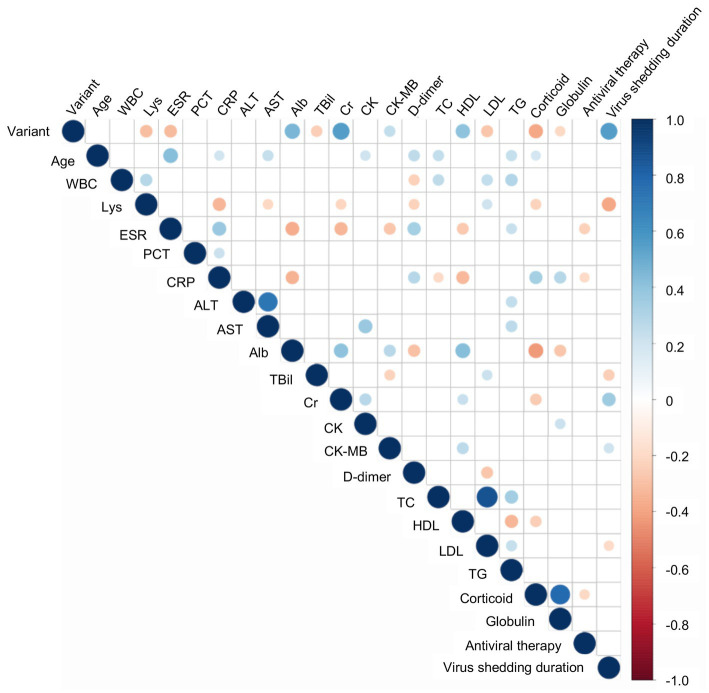
Figure 1.
The correlation analyses between virus shedding time and other variables. Digits represent Spearman correlation coefficients, filled color indicates a significant correlation, blue represents a positive correlation, red represents a negative correlation, and the color’s shade represents the correlation’s strength. WBC, White blood cell count; Lys, Lymphocyte; ESR, Erythrocyte sedimentation rate; PCT, Procalcitonin; CRP, C-reactive protein; ALT, Alanine aminotransferase; AST, Aspartate aminotransferase; TBil, Total bilirubin; Cr, Creatinine; Chol, Cholesterol; HDL, High density lipoprotein; LDL, Low density lipoprotein; TG, Triacylglycerol.

