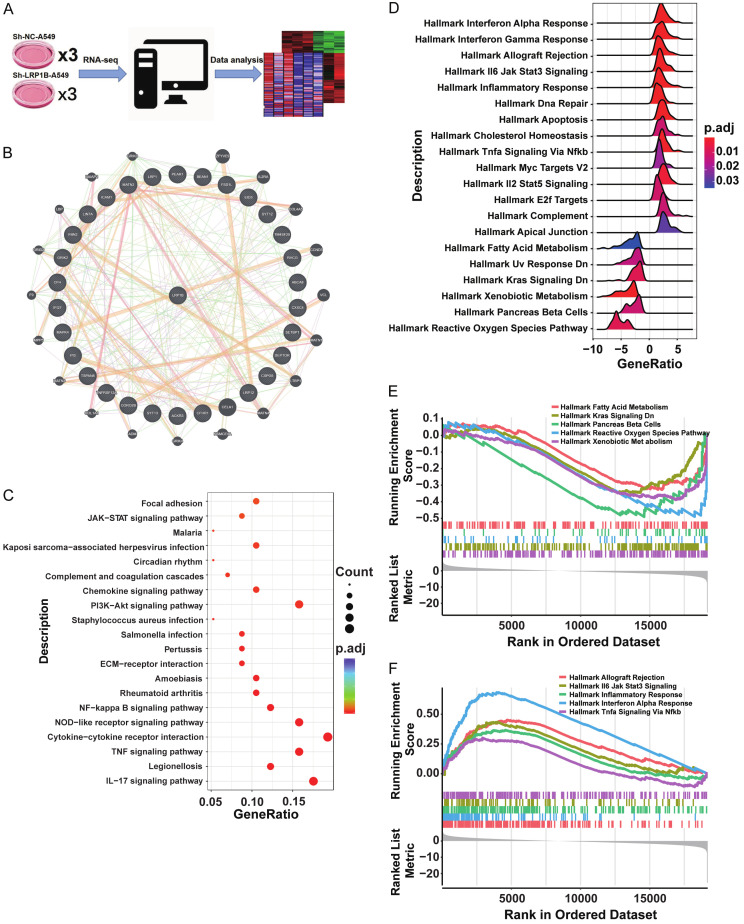
Figure 5.
Transcriptomic analysis reveals enrichment of JAK-STAT pathway in shLRP1B subgroup. A. Schematic diagram of RNA-seq in shLRP1B and shNC cell subsets. B. Differentially expressed genes in the LRP1B subgroup obtained from combined results of cell-line RNA-seq and TCGA RNA-seq. The 30 most differentially expressed genes were used to construct the Protein-Protein Interaction Networks. C. KEGG pathway analyses of differentially expressed genes in Control and Knockdown groups LRP1B of A549. D-F. Hallmark pathway enrichment analyses of differentially expressed genes in low and high LRP1B expression subgroups of TCGA.

