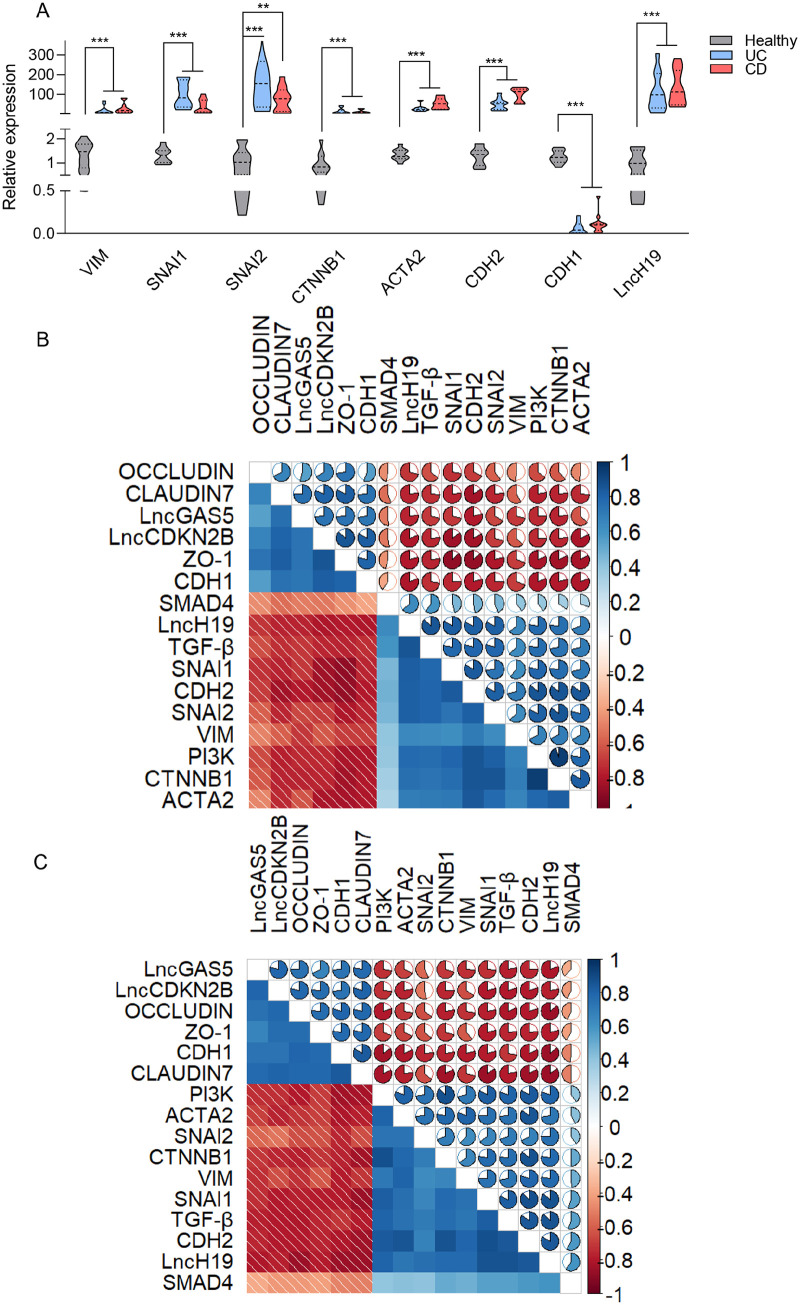
Figure 3.
TGF-β1 signaling correlates with the EMT pathway in IBD. (A) Changes in the levels of VIM, SNAI1, SNAI2, CTNNB1, α-SMA, CDH2, CDH1, and LncH19 mRNA in CD and UC patients were detected by qRT-PCR. Correlation analysis of gene pairs of (B) UC and (C) CD conditions. Correlations are indicated by the ellipticity and color of the ellipses as well as the numbers. The bar on the right represents the correlation values of PCCs. All the correlations have a significant P value of less than 0.05. Results are presented as the mean ± SEM. In vitro analyses were performed in three biological replicates. *, **, and *** refer to the adjusted P value < 0.05, <0.01, and <0.001, respectively.

