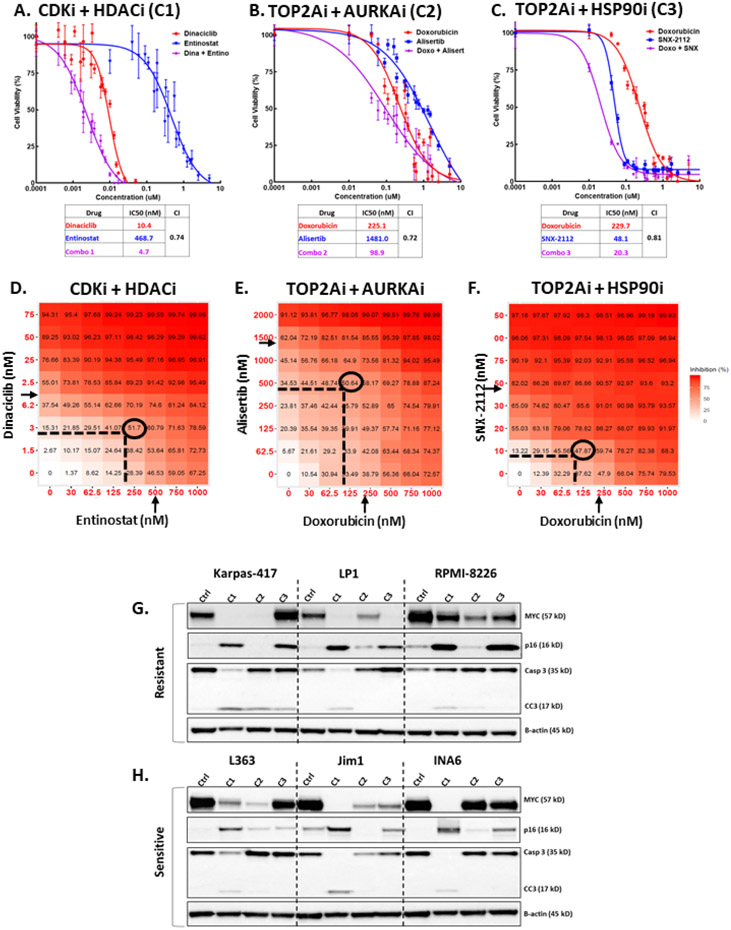
Figure 2.
High-throughput drug screen reveals combinations that synergistically reduce viability of MM cells and cooperatively target MYC and p16. A-C) Dose-response curves for top 3 drug combinations in L363 MM cells. Cell viability was assessed with MTS assay 48h after treatment with escalated dose concentrations of either drug individually or in combination at a 1:1 molar ratio. Each data point represents mean of 4 wells and error bars indicate replicate standard deviation. Each table lists IC50 (in nM) values for individual drugs and combinations. Chou-Talalay computation of combination indices (CI) for treated cells are shown for 50% affected fraction 48 hours post-exposure. Synergy is interpreted as CI<1.0. D-F) Graphical depiction of dose-matrix analyses for the top drug combinations in L363 MM cells. Percent inhibition of cell growth is shown for each different combination of doses and colorized in red. Cells were treated for 48 hours with different concentrations of each drug (indicated by X- and Y-axes) singly or in combination. Arrows indicate individual drug IC50 (half-maximal inhibitory concentration) as determined by MTS dose-response assay, ovals surround optimal dose for combinations, as determined by synergy scoring. G-H) Representative WB analysis of MM cell lines resistant or sensitive to all 1920 drugs used in the screen (see Table 3). Three resistant and three sensitive cell lines were treated for 24 hours with the top 3 drug combinations at the IC50 concentration (the concentration at half-maximal activity; equal to IC50) for each line (C1 = dinaciclib (CDKi) + entinostat (HDACi), C2 = Doxorubicin (TOP2Ai) + Alisertib (AURKAi), C3 = Doxorubicin + SNX-2112 (HSP90i). Lysates of treated cells were probed for MYC, p16, total and cleaved caspase 3 (Casp3 and CC3, respectively), and β-actin.

