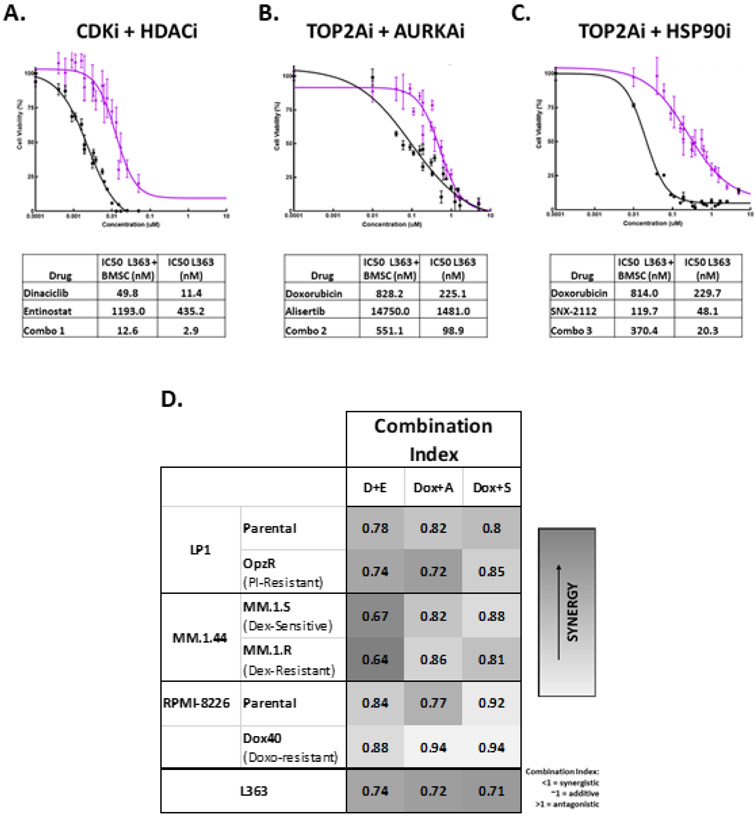
Figure 3.
Evaluation of synergy in top drug combinations. A-C) Dose-response curves, along with tables listing IC50 in nM, for L363 MM cells in monoculture and L363 MM cells cocultured with HS-5 bone marrow derived stromal cells (BMSC) treated for 48 hours with increasing concentrations of the top 3 drug combinations (A = CDKi/HDACi, B = TOP2Ai/AURKAi, C = TOP2Ai/HSP90i). Black curves represent percent viability following combination treatment, relative to DMSO-treated control, in L363 cells cultured alone, purple curves show combination dose responses for L363 cocultured with human HS-5 BMSC. D) Heat-map depicting Chou-Talalay combination index scores for the following parental MM cell lines and their drug-resistant counterparts: LP1-Parental and LP1-OpzR (resistance induced via prolonged incubation with the proteasome inhibitor (PI) oprozomib (Opz)), Dexamethasone (Dex)-sensitive MM.1.S and Dex-resistant MM.1.R cells, RPMI-8226-Parental and RPMI-8226-Dox40 (treatment-induced resistance to the topoisomerase inhibitor doxorubicin), all compared to CI scores of L363. D+E = dinaciclib (CDKi) + entinostat (HDACi), Dox + A = doxorubicin (TOP2Ai) + alisertib (AURKAi), Dox + S = doxorubicin + SNX-2112 (HSHP90i). Darker gray = more synergy.

