Figure 4.
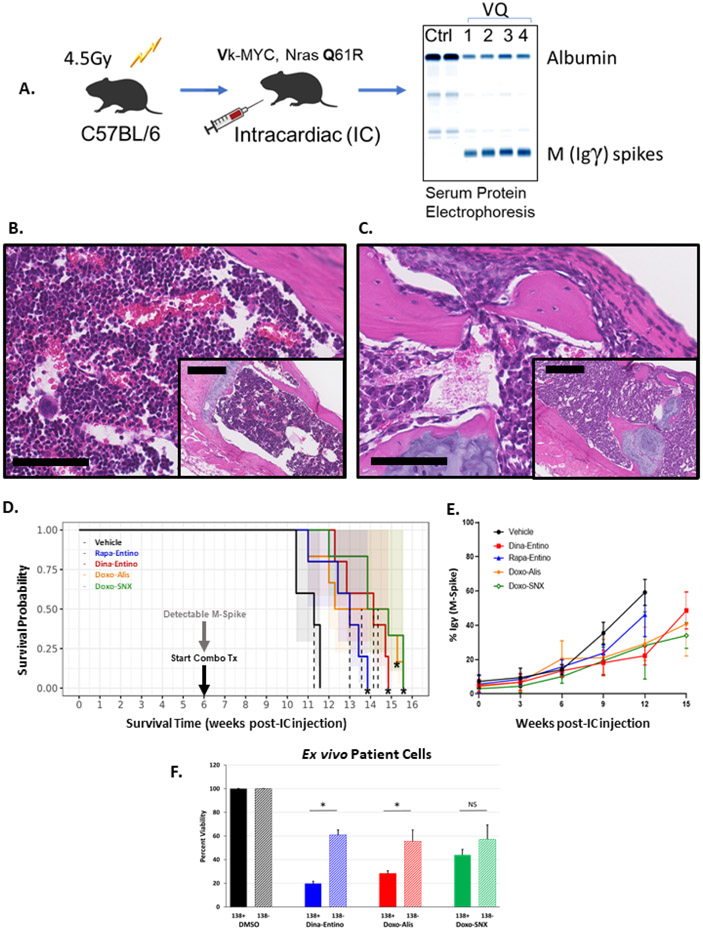
Evaluating the top drug combinations in a novel allograft mouse model of MM and human myeloma cells ex vivo. A) Illustration of VQ inoculation scheme. 6–8-week-old C57BL/6J mice were sublethally irradiated then injected intracardiac with 5x10^6 Vk*MYC; NrasLSL Q61R/+; IgG1-Cre (VQ) cells harvested from bone marrow of donor mice. After 6-8 weeks, serum M-spikes, as evidenced by the γ immunoglobulin band on serum protein electrophoresis, are evident. Once M-spikes were detected in mice, treatment with the top drug combinations commenced. B-C) Photomicrographs (bar =100 μm; inset bar = 250 μm; H&E stain) of C57BL/6J mouse sternum 12 weeks post-IC injection with either saline (B, normal bone marrow) or VQ cells (C, marrow replaced by neoplastic plasma cells). D) Survival plots of C57BL/6J mice injected with 5x10^6 VQ cell IC, treated with the top drug combinations vs a previously investigated combination of rapamycin (mTORi) and entinostat (HDACi), all compared to DMSO-treated control mice. CDKi (dinaciclib, 20 mg/kg, IP, 3x/week + HDACi (entinostat, 20 mg/kg, PO 5x/week; TOP2Ai, (doxorubicin,4 mg/kg IV 1x/week) + AURKAi (alisertib, 30 mg/kg PO 5x/week); or HSP90i (SNX-2112, 20 mg/kg, PO, 3x/week), n= 5. * indicates significantly prolonged survival vs. DMSO-treated control mice (p < 0.01, Log-Rank test). E) Graphical representation of mean M-spike percentage for each treatment group of mice administered one of the top drug combinations, combined mTORi-HDACi, or DMSO control. Each data point represents mean M-spike percentage of all mice for a given time point, error bars indicate standard deviation amongst group mice. F) Viability of human CD138 positive (MM) and CD138 negative cells extracted from bone marrow of smoldering multiple myeloma patients (n=3). Cells were selected for CD138 status using magnetic-activated cell sorting (MACS). CD138 positive and negative cells were treated with the top 3 combinations of dinaciclib (10 nM) and entinostat (500 nM), doxorubicin (225 nM) and alisertib (2 μM), or doxorubicin (225 nM) and SNX-2112 (50 nM) for 48 hours. Solid bars indicate average viability for each combination in CD138 positive cells, hash-marked bars indicate the average viability for CD138 negative cells. Error bars = standard deviation. * =p <0.001; NS = no significance p > 0.05 by unpaired two-tailed Student’s t test.

