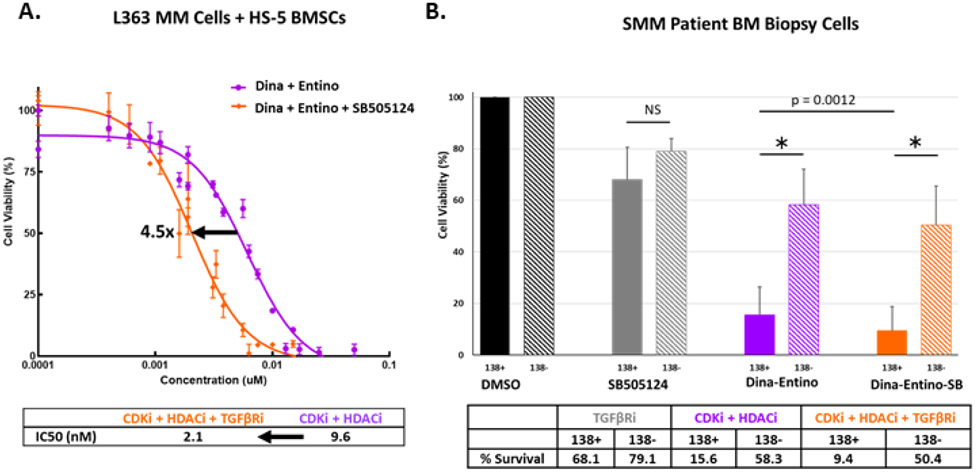
Figure 6.
Co-targeting the TGFβ pathway with combination therapy. A) Dose-response curves for L363 MM cells, co-cultured with HS-5 BMSCs for 48 hours with escalated doses of either combined CDKi/HDACi of dinaciclib and entinostat (purple curve) or combined CDKi/HDACi + TGFβRi (orange curve; dinaciclib + entinostat + SB505124) at a 1:1 or 1:1:1 molar ratio (in nM), respectively. Arrow = IC50 shift. B) Viability of human CD138 positive (MM) and CD138 negative cells extracted from bone marrow of SMM patients (n=3). Cells were selected for CD138 status using MACS. CD138 positive and negative cells were treated with the SB505124 (TGFβRi – 5 uM), dinaciclib (CDKi – 10 nM) and entinostat (HDACi – 500 nM), or CDKi + HDACi + TGFβRi for 48 hours. Solid bars indicate the average viability of CD138 positive cells and hash-marked bars represent the average viability for CD138 negative cells. Error bars = standard deviation. * = p <0.001; NS = no significance p > 0.05 by unpaired two-tailed Student’s t test. p = 0.0012 indicates p-value for significance in comparison of CD138 positive cells treated with CDKi + HDACi versus CDKi + HDACi + TGFβRi.

