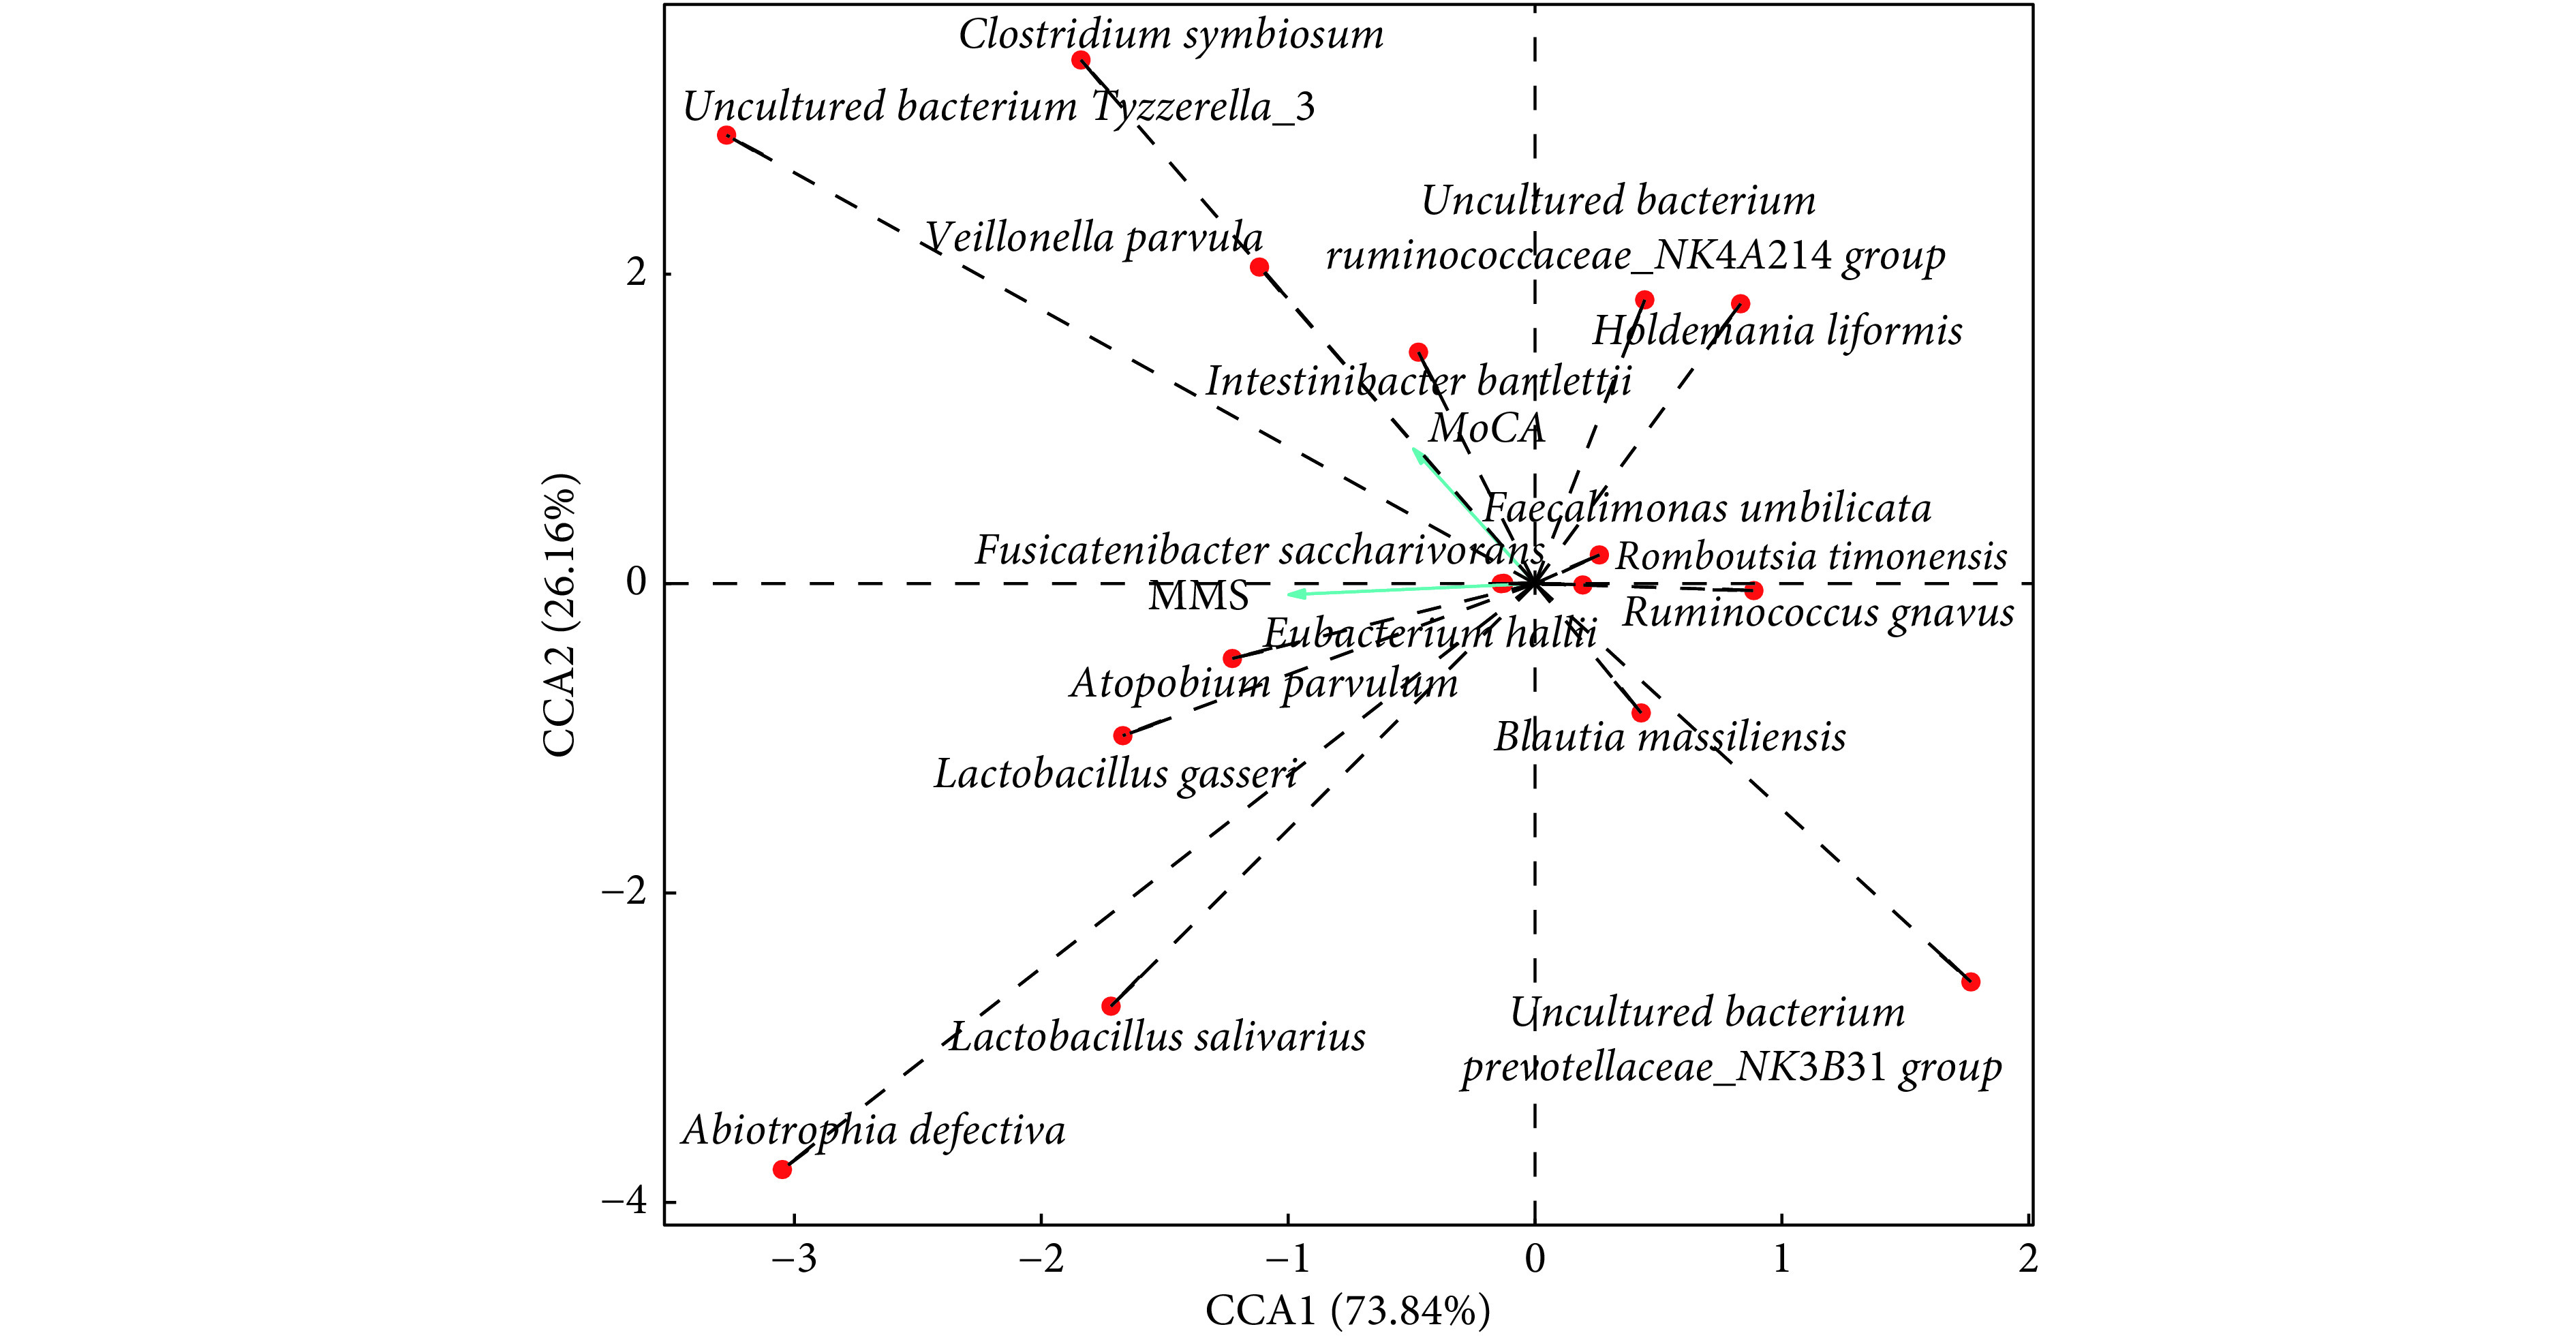
图 5.

CCA correlation analysis of the gut microbiota and cognition scores at the species level
种水平肠道菌群和认知评分之间相关性CCA分析图
The scales on the horizontal and vertical coordinates are the values generated by the regression analysis of each sample or species with environmental factors. The red dots indicate species with statistical differences between the two groups, and the green arrows represent environmental factors (MoCA and MMSE). The relationship between rays is represented by an included Angle, obtuse representing a negative correlation and acute representing a positive correlation.
