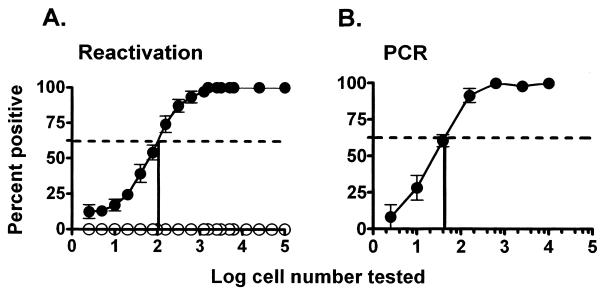
FIG. 3.
Relationship between the frequency of cells reactivating γHV68 and the frequency of cells carrying the γHV68 genome in C57BL/6 PECs 9 to 10 days postinfection. Shown is the percentage of wells in which γHV68 reactivation was detected (A) or the percentage of PCRs which were positive for the presence of the viral genome (B) as a function of the number of cells analyzed. For each cell number, 24 wells in the reactivation analysis (A) or 12 to 24 PCRs (B) were analyzed in each experiment. The data presented are averages of seven separate experiments, and each experiment involved a pool of three mice. The dotted line indicates 62.5%, which was used to calculate the frequency of reactivating or genome-positive cells by Poisson distribution. The error bars represent the standard error of the mean. (A) Frequency of cells that reactivated γHV68 assessed by using the limiting-dilution reactivation assay as described in Materials and Methods. The results of the reactivation assay using disrupted cells, representing the presence of preformed infectious virus, are shown as open symbols. (B) Frequency of cells carrying the γHV68 genome determined by limiting-dilution PCR analysis. Each point represents 84 to 168 separate PCRs.

