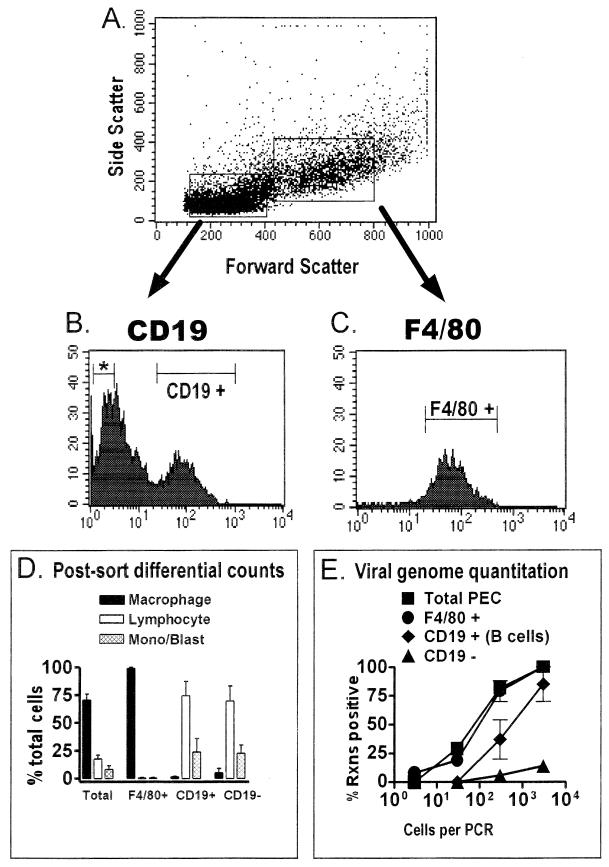
FIG. 5.
The frequency of macrophages harboring the viral genome is higher than the frequency of B cells harboring the viral genome in the peritoneum of latently infected C57BL/6 mice. PECs isolated from C57BL/6 mice 13 to 15 days postinfection with γHV68 were stained with F4/80 (specific for macrophages) or with a CD19-specific antibody (specific for B cells), and relevant cell populations were isolated by FACS sorting. The results shown represent two separate experiments. (A) Cells were pregated into lymphocyte-enriched or macrophage-enriched populations based on forward scatter and side scatter characteristics, as shown for a representative experiment. (B) PECs from the lymphocyte-enriched population were sorted into CD19-negative (denoted by an asterisk) and CD19-positive fractions. Shown are the results of CD19 staining and the gates used for FACS sorting of CD19-positive and CD19-negative cell populations from a representative experiment. Gates for sorting were drawn tightly to prevent contamination of sorted populations. By these criteria, 40 to 50% of cells from the lymphocyte-enriched gate were sorted as CD19 negative and 16 to 24% of the cells from the lymphocyte-enriched gate were sorted as CD19 positive. (C) F4/80-positive PECs were sorted from the macrophage-enriched population. Shown are the results of F4/80 staining and the gate used for FACS sorting of F4/80-positive cells from a representative experiment. For the two experiments performed, 91 to 94% of the PECs from the macrophage-enriched gate were sorted as F4/80 positive. (D) Pre- and postsorting differential analysis of Wright’s-stained cells. Cells were categorized by morphological criteria as macrophages, lymphocytes, or monocytes-lymphoblasts (Mono/Blast). Based on morphological criteria, monocytes could not always be distinguished from lymphoblasts. (E) Limiting-dilution nested PCR analysis to quantitate the frequency of γHV68 genome-positive cells in the total PECs and the F4/80-positive, CD19-positive, and CD19-negative populations. Tenfold dilutions of each cell population were tested for the presence of the γHV68 genome by nested PCR. The data in panels D and E are averages of two separate experiments. The error bars represent the standard error of the mean. Rxns, reactions.

