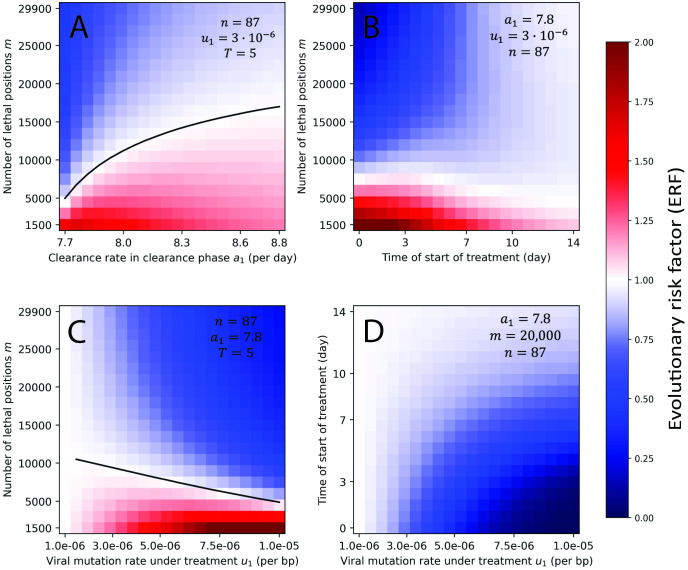
Fig 4. ERF for a grid of parameters.
For each pair of parameters, we numerically compute the ERF for a range of values, while all other parameters are fixed. We observe that the value of n has little effect on the ERF. Evolutionary risk factors above 1 are only observed for low values of the number of lethal positions, m. The ERF decreases with early treatment, high viral mutation rate under treatment, and large number of lethal positions. Initial condition: x0 = 1 and y0 = 0. The code used to generate this figure can be found at DOI: 10.5281/zenodo.8017992. ERF, evolutionary risk factor.

