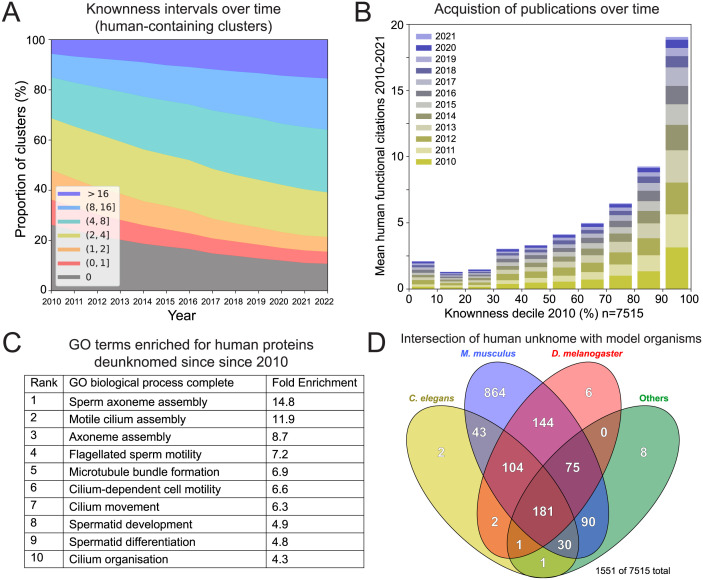
Fig 2. Analysis of trends in knownness.
(A) Change in the distribution of knownness of the 7,515 clusters that contain at least 1 protein from humans. (B) Mean number of publications added each year since 2010 to the UniProt entry for the human protein in each of the 7,515 clusters that contain at least 1 human protein, ranked into deciles based on knownness at 2010. Where there was more than 1 human protein in the cluster, their publications were summed. The best-known clusters in 2010 received the most publications in subsequent years. (C) The 10 largest GO term enrichments for the 753 human proteins from clusters whose knownness has increased from 0 in 2010 to 2.0 or above by 2022. When there was more than 1 human protein in the cluster, a single one was used chosen by alphabetical order to avoid bias. GO enrichment analysis used ShinyGO [112]. (D) Venn diagram showing the distribution of genes from the indicated species in the 1,551 clusters of knownness <2.0 and which contain at least 1 human protein. Not shown are the 55 clusters that appear only in humans. The data underlying the graphs shown in the figure can be found in S1 Data. GO, Genome Ontology.

