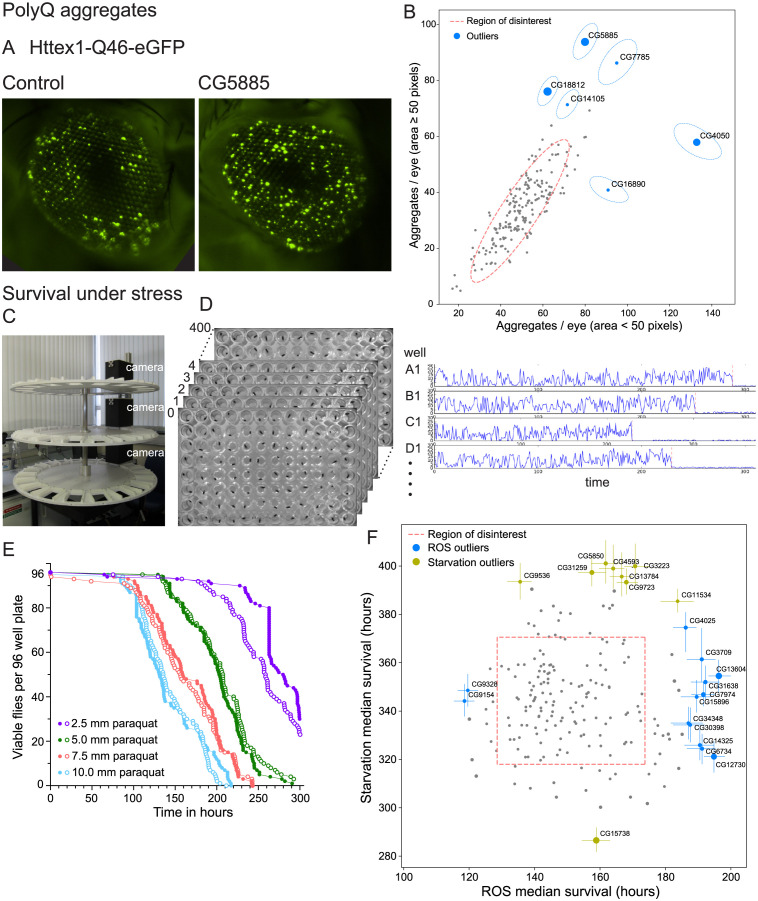
Fig 4. Testing of the unknome set of genes for roles in quality control and responses to stress.
(A) Fluorescence micrographs of eyes from stocks expressing Httex1-Q46-eGFP along with either no RNAi, or one to the screen hit CG5885, both under the control of the GMR-GAL4 driver. The GFP fusion protein forms aggregates whose number and size increase over time. (B) Plot of the mean number of large (≥50 pixels) or small (<50 pixels) aggregates of Httex1-Q46-eGFP formed after 18 days in flies in which the unknome set of genes has been knocked-down by RNAi (pixel dimensions 0.5 μm × 0.5 μm). Errors are shown as tilted ellipses with the major/minor axes being the square roots of the eigenvectors of the covariance matrix. Dotted lines indicate an outlier boundary set at 90% of the variation in the dataset, with the genes named being those whose position outside of the boundary is statistically significant with a p-value <0.05, with the size of the circles being inversely proportional to the p-value. (C) Flywheel apparatus for time-lapse imaging of 96-well plates containing 1 fly per well. Each of 3 wheels holds 20 plates that rotate under a camera to be imaged once per hour. (D) Use of time-lapse imaging to assay viability: 96-well plates were imaged very hour and the movement between frames quantified for the fly in each well. Plots of movement size over time allow the time point for cessation of movement and hence loss of viability to be determined automatically. (E) Survival plots obtained from the flywheel for flies in 96-well plates with food containing the indicated concentration of oxidative stressor paraquat. Increased levels of the paraquat shorten survival times. Two independent 96-well plates are shown for each condition to illustrate the reproducibility of the assay. (F) Plot of the median survival time of fly lines in which the unknome set of genes has been knocked-down by RNAi and which were then exposed to paraquat to induce oxidative stress or were starved for amino acids. Dotted lines indicate an outlier boundary set at 80% of the variation in the dataset, with the genes named being those whose position outside of the boundary is statistically significant (p-value <0.05), with error bars showing standard deviation and the size of the circles inversely proportional to the p-value. The means and variances used for the graphs shown in (B) and (F) can be found in S2 Data with the individual data points in S3 Data. The data underlying the graph in (E) can be found in S1 Data. RNAi, RNA interference.

