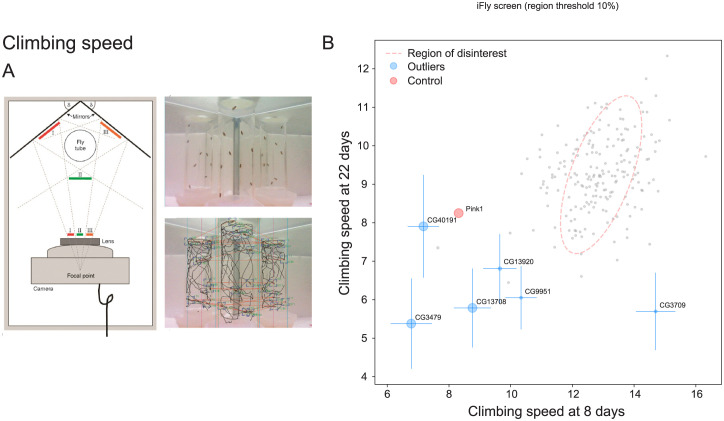
Fig 5. Testing the unknome set of genes for roles in locomotion.
(A) iFly tracking system for automatic quantitation of Drosophila locomotion (reproduced from Kohlhoff and colleagues [80]). Drosophila are knocked to the bottom of a glass vial and placed in an imaging chamber that allows viewing from 3 angles and their climbing tracked automatically. (B) Plot of the mean climbing speeds of fly lines in which the unknome set of genes has been knocked down by RNAi, and the speeds for each line were determined after 8 days or 22 days post eclosion. Loss of the Parkinson’s gene Pink1 affects climbing speed and it was included as a control [115]. Dotted lines indicate an outlier boundary set at 90% of the variation in the dataset, with the genes named being those whose position outside of the boundary is statistically significant with a p-value <0.1, with error bars showing standard deviation and the size of the circles inversely proportional to the p-value. The means and variances used for the plot shown in the figure can be found in S2 Data with the data points in S3 Data. RNAi, RNA interference.

