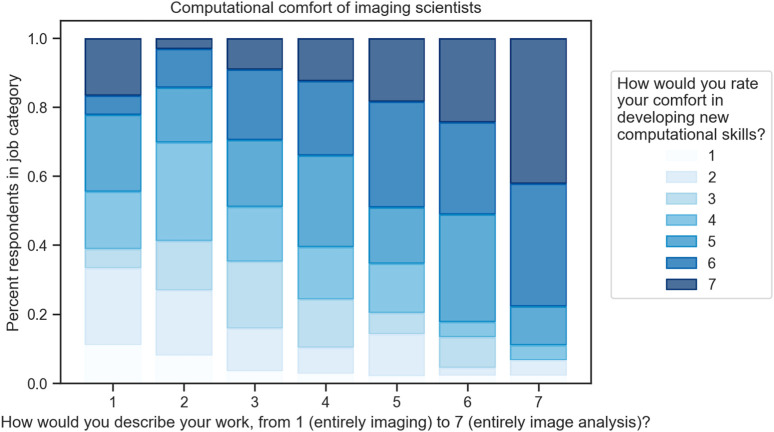
FIGURE 2.
Computational comfort of scientists in a variety of work types. Approximately 500 respondents who use scientific imaging in the life or physical sciences were asked to describe their work on a scale from “entirely imaging” and “entirely image analysis”; in parallel, they were asked to report their comfort developing new computational skills. While the highest comfort levels are present in all groups, they are more common in users who spend more time performing analysis, and the lowest levels of comfort are represented almost entirely in the lower bins of computational work level. Data are normalized within each work level by the number of responses in that level: 1:18, 2:63, 3:88, 4:185, 5:59, 6:45, 7:45 Data from (Sivagurunathan et al., 2023).

