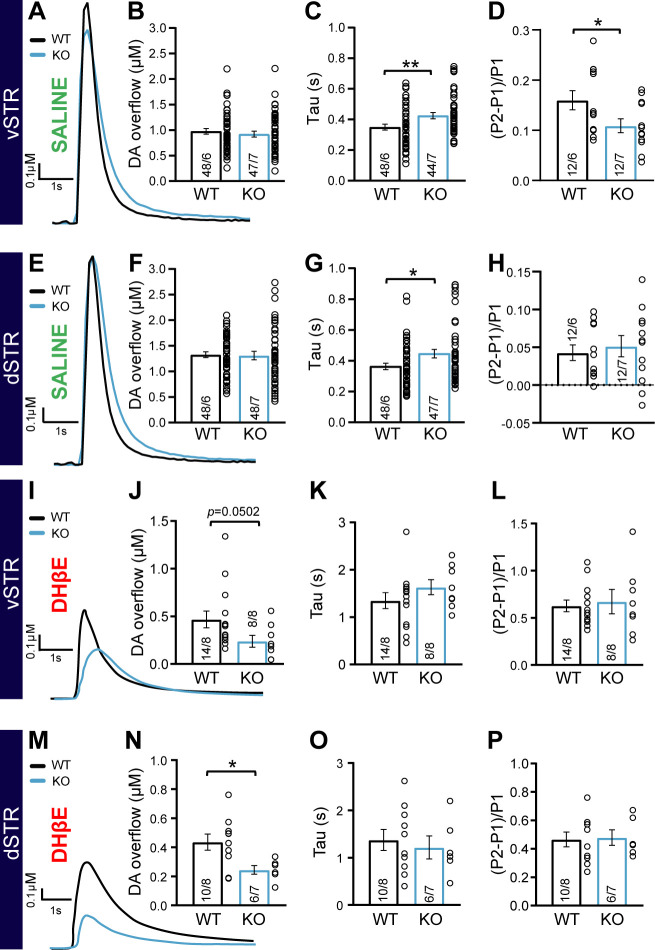
Figure 4. Impaired dopamine (DA) overflow in DAT::NrxnsKO mice.
(A) Representative traces of electrically evoked DA overflow detected by fast-scan cyclic voltammetry in the ventral striatum, measured in slices prepared from DAT::NrxnsWT and DAT::NrxnsKO mice. (B) Bar graphs showing the average peak DA levels (µM) detected in the ventral striatum (WT = 0.98 ± 0.04 µM and KO = 0.98 ± 0.06 µM). (C) Evaluation of DA overflow kinetics in the ventral striatum estimated by quantifying tau (WT = 0.35 ± 0.02 and KO = 0.42 ± 0.02). (D) Short-term paired-pulse induced plasticity of DA overflow in ventral striatal slices, estimated by calculating (P2-P1/P1) with an inter-pulse interval of 100 ms. The low ratio values reflect the strong paired-pulse depression seen at such release sites in acute brain slices. (E) Representative traces of electrically evoked DA overflows detected by fast-scan cyclic voltammetry in the dorsal striatum. (F) Bar graphs showing the average peak DA levels (µM) detected in the dorsal striatum (WT = 1.33 ± 0.05 µM and KO = 1.35 ± 0.07 µM). (G) Evaluation of DA overflow kinetics in the dorsal striatum, estimated by quantifying tau (WT = 0.36 ± 0.02 s and KO = 0.45 ± 0.03 s). (H) Short-term paired-pulse induced plasticity of DA overflow in dorsal striatal slices, estimated by calculating (P2-P1/P1) with an inter-pulse interval at 100 ms. The low ratio values reflect the strong paired-pulse depression seen at such release sites in acute brain slices. (I) Representative traces of electrically evoked DA overflow detected by fast-scan cyclic voltammetry in the ventral striatum, measured in slices prepared from DAT::NrxnsWT and DAT::NrxnsKO mice in the presence of the nicotinic receptor antagonist DHßE. (J) Bar graphs showing the average peak DA levels (µM) detected in the ventral striatum (WT = 0.47 ± 0.09 µM and KO = 0.24 ± 0.06 µM). (K) Evaluation of DA overflow kinetics in the ventral striatum estimated by quantifying tau (WT = 1.35 ± 0.17 s and KO = 1.63 ± 0.16 s). (L) Short-term paired-pulse induced plasticity of DA overflow in ventral striatal slices, estimated by calculating (P2-P1/P1) with an inter-pulse interval of 100 ms. The low ratio values reflect the strong paired-pulse depression seen at such release sites in acute brain slices. (M) Representative traces of electrically evoked DA overflow detected by fast-scan cyclic voltammetry in the dorsal striatum in the presence of the nicotinic receptor antagonist DHßE. (N) Bar graphs showing the average peak DA levels (µM) detected in the dorsal striatum (WT = 0.43 ± 0.05 µM and KO = 0.24 ± 0.03 µM). (O) Evaluation of DA overflow kinetics in the dorsal striatum, estimated by quantifying tau (WT = 1.37 ± 0.22 s and KO = 1.21 ± 0.24 s). (P) Short-term paired-pulse induced plasticity of DA overflow in dorsal striatal slices, estimated by calculating (P2-P1/P1) with an inter-pulse interval at 100 ms. The low ratio values reflect the strong paired-pulse depression seen at such release sites in acute brain slices. Data are presented as mean ± SEM. Statistical analyses were performed with Student’s t-tests (*p<0.05; **p<0.01).
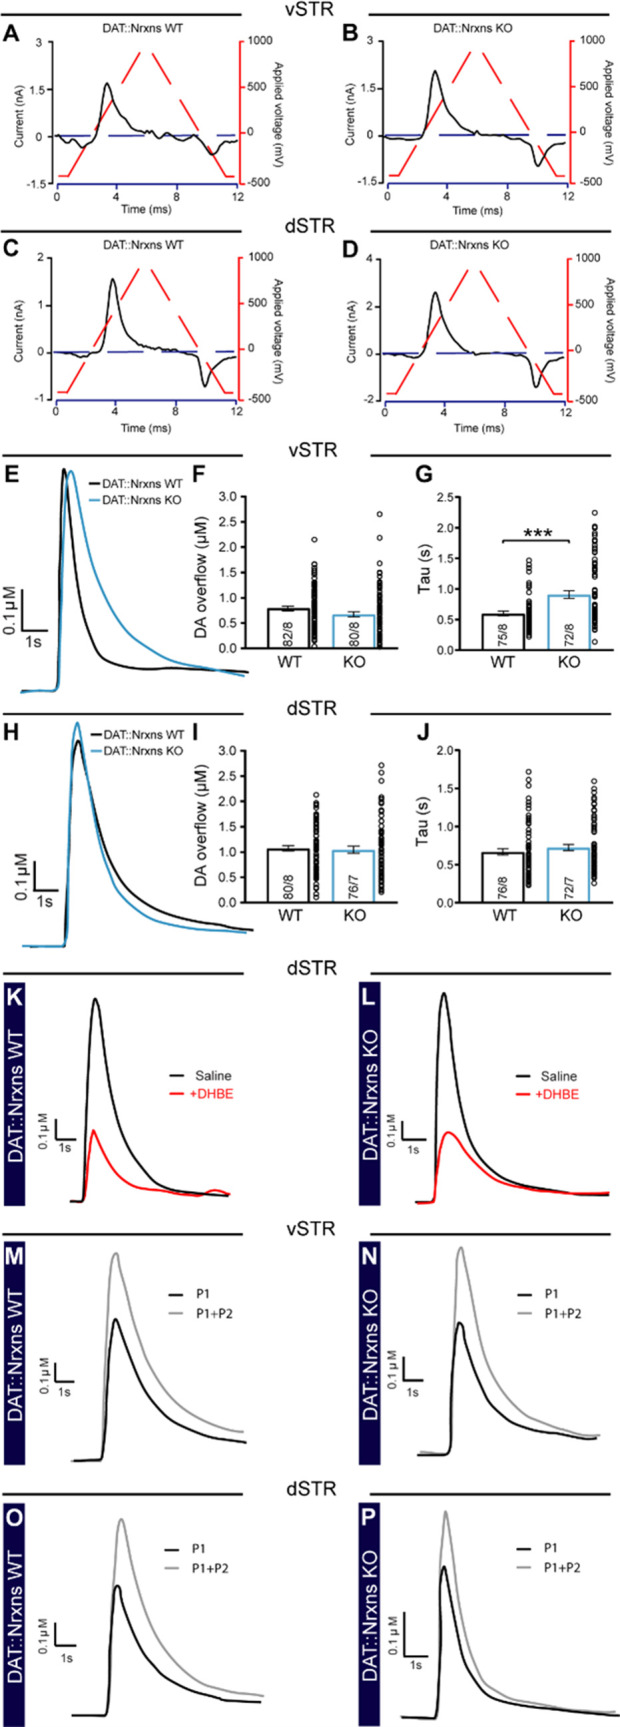
Figure 4—figure supplement 1. Detection of activity-dependent dopamine (DA) overflow by fast-scan cyclic voltammetry (FSCV).


