. 2023 Jul 6;12:e87902. doi: 10.7554/eLife.87902

Figure 5. GABA release from dopamine (DA) neuron terminals in the ventral striatum is increased in DAT::NrxnsKO mice.

(A) Experimental timeline and schematic for performing electrophysiological measurements from DAT::NrxnsKO and WT mice that were injected with AAV-EF1a-ChR2-EYFP in the ventral tegmental area (VTA) and substantia nigra pars compacta (SNc). (B) Representative image of virus expression in the mesencephalon (injection site) and striatum (projection) 6–8 weeks after stereotaxic viral injection. (C) Representative traces of optically evoked inhibitory postsynaptic currents (IPSCs) in the ventral striatum for WT and KO mice; summary plot showing a significant increase in average amplitude of optically evoked IPSCs for KO mice. (D) Representative traces of optically evoked IPSCs in the ventral striatum, shaded area represents the window used to calculate decay time constant; summary plot showing a trend toward an increase in decay time constant for KO mice. (E) Representative traces of optically evoked IPSCs in the dorsal striatum for WT and KO mice; summary plot showing no change in average amplitude of optically evoked IPSCs. (F) Representative traces of optically evoked IPSCs in the dorsal striatum, shaded area represents the window used to calculate decay time constant; summary plot showing no changes in decay time constant. Data are presented as mean ± SEM. Statistical analyses were performed with Mann-Whitney tests (**p<0.01).

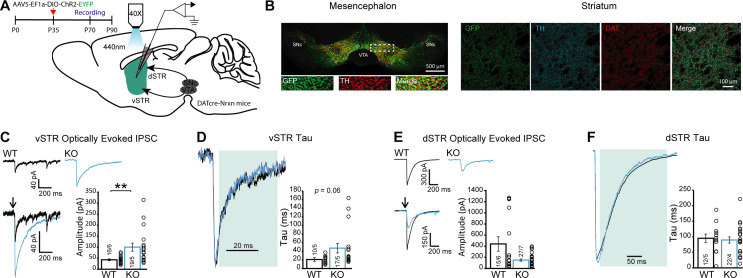
Figure 5—source data 1. Contains the primary data for Figure 5 and Figure 5—figure supplements 1 and 2.

Figure 5.

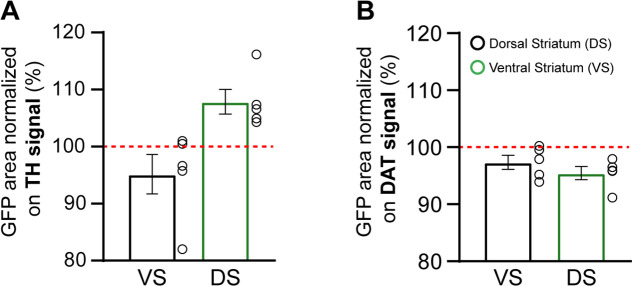
Figure 5—figure supplement 1. Quantification of green fluorescent protein (GFP) signal in the striatum after viral transduction of dopamine neurons.

Figure 5—figure supplement 1.

(A) Summary graph of the GFP-positive area quantification normalized on tyrosine hydroxylase (TH) signal for the ventral striatum (vSTR) and the dorsal striatum (dSTR). (B) Summary graph of the GFP-positive area quantification normalized on dopamine transporter (DAT) signal for the vSTR and the dSTR. N=4–5 brains per group, mean ± SEM.
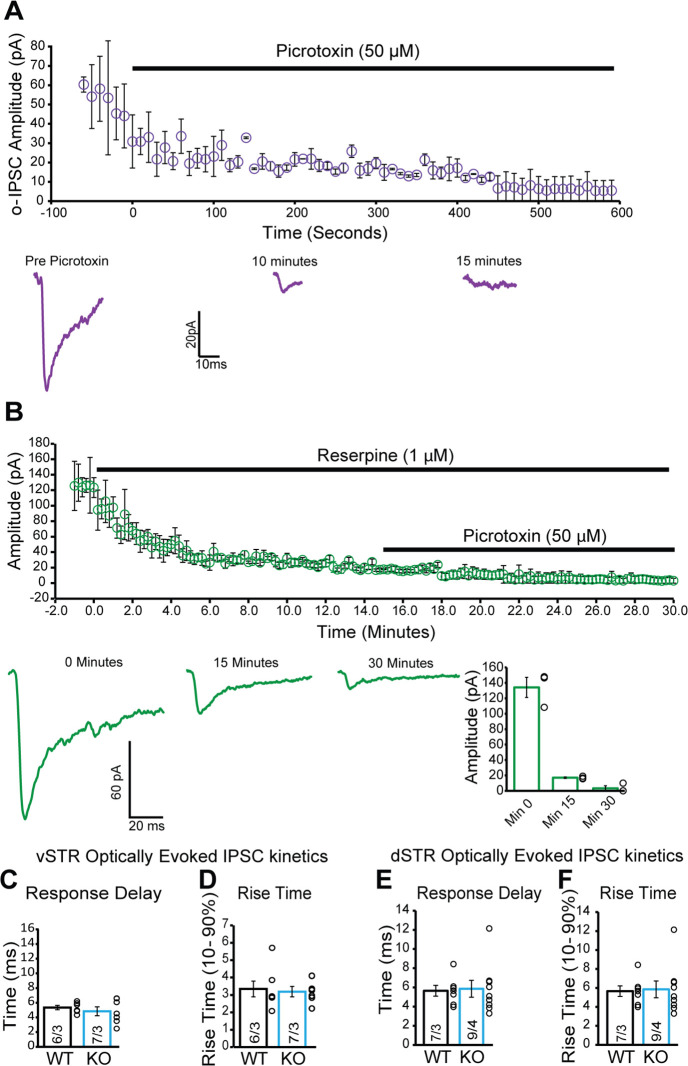
Figure 5—figure supplement 2. GABA currents evoked from dopamine (DA) terminals in the ventral striatum (vSTR) are blocked by inhibiting vesicular monoamine transporter (VMAT2).

Figure 5—figure supplement 2.

(A) Time-course plot showing the peak amplitude response of optically evoked inhibitory postsynaptic current (oIPSCs) while applying 50 µM picrotoxin (PTX) to the recording solution (N=2); representative traces of oIPSCs at three timepoints of the recording (pre-drug, 10 min after PTX, and 15 min after PTX). (B) Time-course plot showing the peak amplitude response of oIPSCs while applying 1 µM of reserpine, a VMAT2 inhibitor, followed by 50 µM PTX to the recording solution; representative traces of oIPSCs at three timepoints of the recording (pre-drug, response in reserpine prior to PTX, and response to reserpine and PTX). (C–D) Summary graphs of oIPSC response delay (C) and rise time (D) recorded in ventral striatal medium spiny neurons (MSNs). (E–F) Summary graphs of oIPSC response delay (E) and rise time (F) in dorsal striatal MSNs.