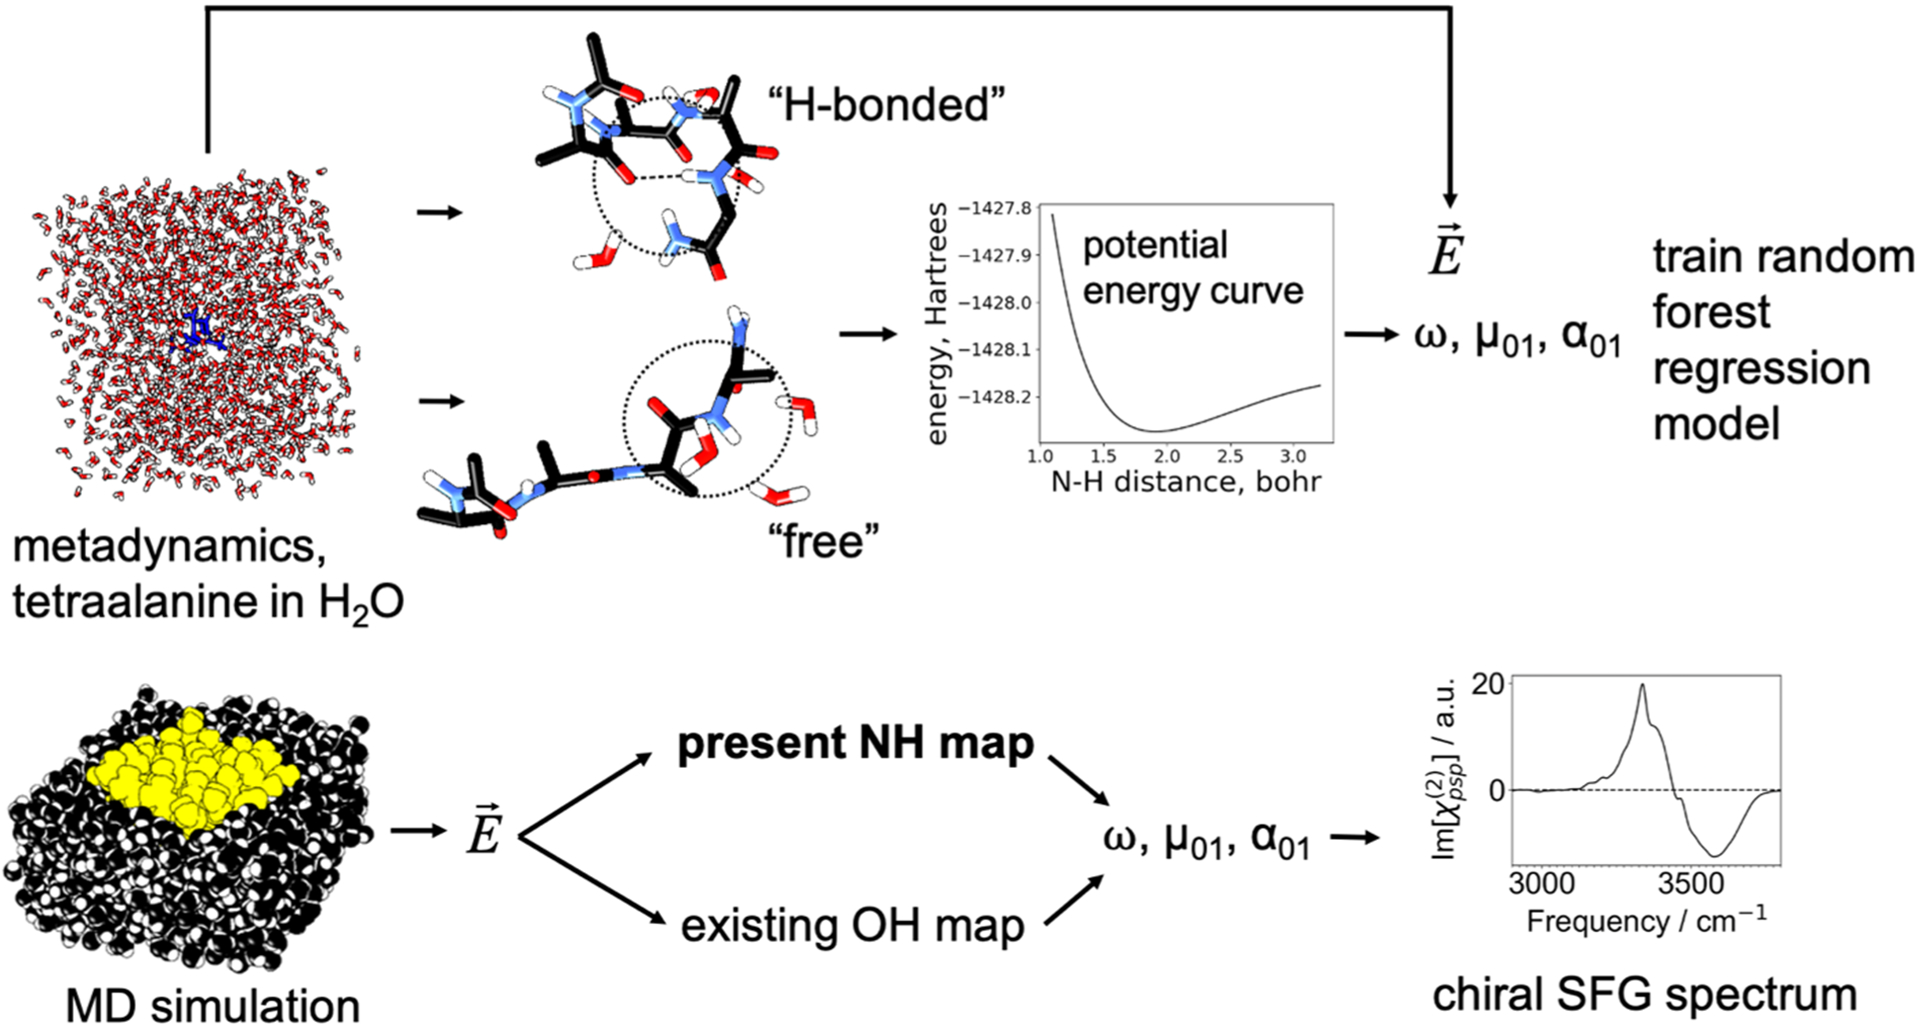
Figure 2.

Top: H-bonded and free structures (400 each) were collected from a metadynamics simulation of tetraalanine in water, and each type of structure was used to produce a map for the corresponding type of environment. For a small cluster extracted from the system, the NH bond was stretched to map out a potential energy curve, and an anharmonic vibrational frequency was calculated. The transition dipole derivatives were estimated for a partially minimized structure of this cluster, and the transition dipole was approximated as the product of the dipole derivative and the transition position matrix element given in equation 1. The electric field was calculated near the NH group (Figure S1) from the MD simulation. The vibrational frequency and transition dipole were mapped to the electric field by a random forest regression model combined with a linear regression model. The transition polarizability was inferred partially from the transition position matrix element (equation 2). Bottom: The map was then used to estimate these quantities from an MD simulation of the protein (yellow) in aqueous solution (black), and a chiral SFG spectrum was generated.
