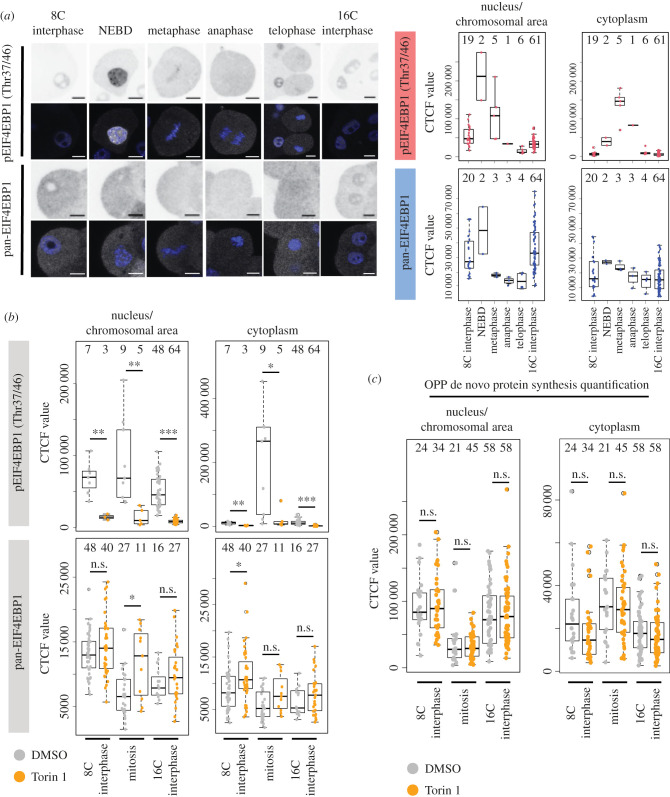
Figure 1.
Enhanced mTOR-dependent expression levels of pEIF4EBP1 during the 8- to 16-cell cleavage division. (a) Example IF staining micrographs of pEIF4EBP1 (Thr37/46) and pan-EIF4EBP1 at either 8- or 16-cell interphase and the individual stages of mitotic division from 8- to 16-cell stage in individual blastomeres (left), as quantified separately for nucleus (interphase cells)/chromosomal area defined by DAPI staining (mitotic cells) and cytoplasm (right). EIF4EBP1 visualized in greyscale, DAPI in blue, representative confocal z-stacks for individual stages shown. Scale: 20 µm. (b) Quantification of IF staining of pEIF4EBP1 (Thr37/46) and pan-EIF4EBP1 in 8- and 16-cell interphase and dividing blastomeres, +/− Torin1. (c) Quantification of nascent translation by O-propargyl-puromycin (OPP) polypeptide incorporation and fluorescent labelling assay in 8- and 16-cell interphase and dividing blastomeres, +/− Torin1. In all graphs, numbers of analysed blastomeres are shown.

