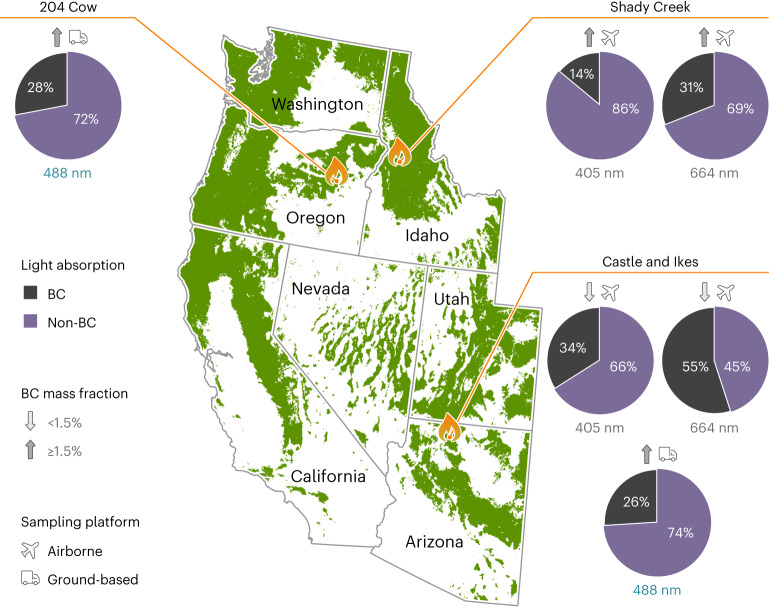
Fig. 1. Shortwave absorption contributions by aerosols during the 2019 wildfire season in western United States.
In situ ground and airborne measurements of refractory BC mass concentration and total aerosol light absorption by the SP2 and PAS, respectively, in smoke plumes of three wildfires—Shady Creek (Idaho), 204 Cow (Oregon) and Castle and Ikes (Arizona)—during July and August of 2019. The pie charts depict mean relative contributions by BC and non-BC components to total light absorption at wavelengths 405 nm and 664 nm (aircraft) and 488 nm (ground). Total mass fractions of refractory BC and non-refractory inorganic and organic components in aerosols near the fire emission sites are shown in Extended Data Fig. 1. Tree coverage data from radicalcartography.net courtesy of William Rankin.

