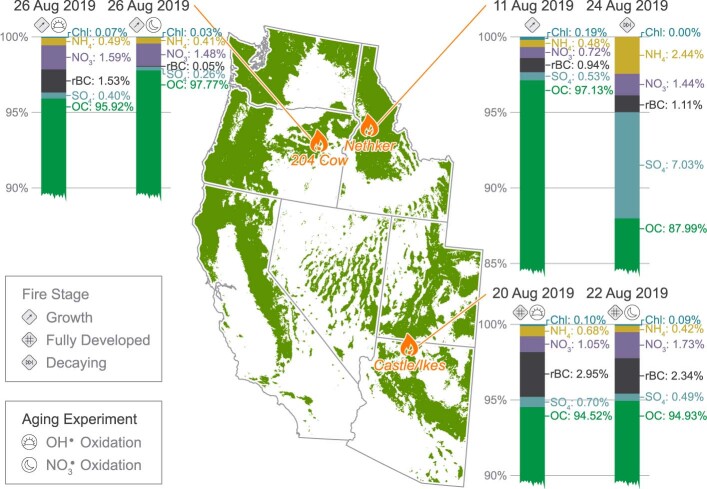
Extended Data Fig. 1. Compositional analysis of sampled smoke.
A map showing the ground-based sampling location and dates of the three wildfires–Nethker/Shady Creek (Idaho), 204 Cow (Oregon), and Castle and Ikes (Arizona)–along with the fire stages investigated and any in situ oxidation experiment (denoted by sun and moon symbols) conducted on the intercepted smoke plumes. The colored bars show the chemical composition of smoke aerosol emissions – non-refractory matter, measured using an aerosol mass spectrometer, and refractory black carbon, measured using a single-particle soot photometer. Tree coverage data from radicalcartography.net courtesy of William Rankin.

