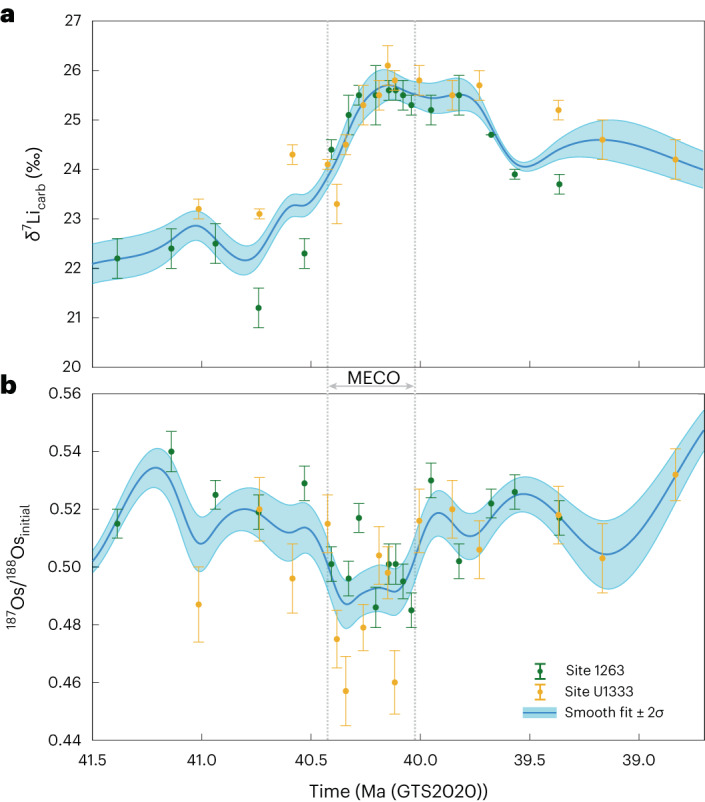
Fig. 2. The general trend of the lithium and osmium isotope records across the MECO.

a,b, The data from Sites 1263 and U1333 have been combined (as with Fig. 1, the filled symbols represent the mean ± 2σ) and smoothing spline fits (mean ± 2σ) have been applied for δ7Licarb (a) and 187Os/188Osinitial (b)16. The grey dotted lines indicate the length of the MECO (~40.425 to ~40.023 Ma) based on the δ18O data from a number of ODP sites tied to an age model framework based on ODP Site 70218. The data are plotted against time (GTS2020).
