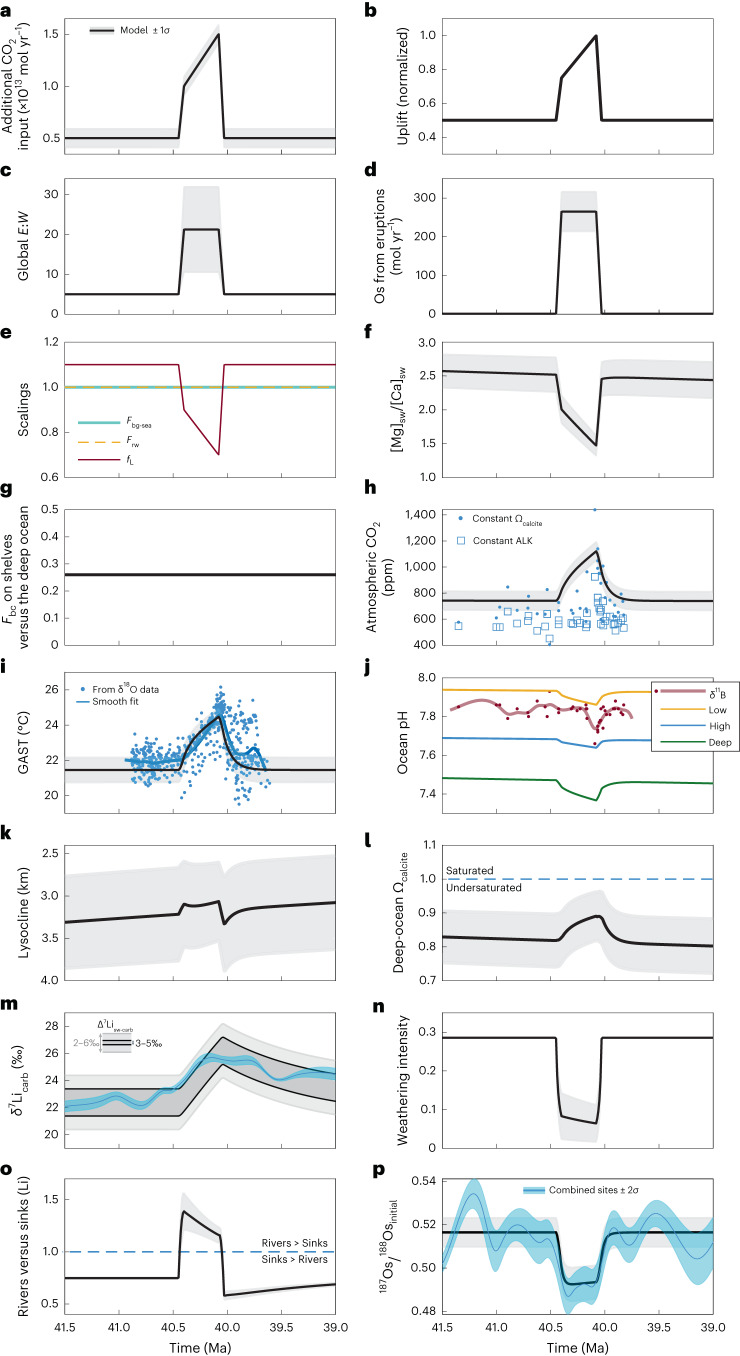
Fig. 3. Key parameter changes to the CARLIOS model and its results for Scenario 8.
a–g, Parameter changes for: an injection of CO2 to the atmosphere (a), a change in the normalized uplift (b), a change to the global erosion-to-silicate-weathering ratio (E:W) (c), a pulsed continental eruption of unradiogenic osmium which is then subaerially weathered (d), scalings for the burial of marine organic carbon (Fbg-sea, blue), reverse weathering (Frw, dashed gold) and the carbonate land area (fL, red) (e), a change to the Mg/Ca ratio in the oceans ([Mg]sw/[Ca]sw) (f) and the factor that apportions carbonate burial (Fbc) to shelf environments, where a lower number indicates more burial on shelves (g). h–p, Key model results for atmospheric (black) plotted against proxy estimations from boron isotope (δ11B) data18 (see Supplementary Information) (h), global average surface temperature (GAST) plotted against proxy estimations from δ18O data (see Supplementary Information) (i), ocean pH (for a low-latitude surface (gold), a high-latitude surface (blue) and a deep ocean (green), and where the red dots and line denote individual pH estimations from δ11B data18 and a smoothed fit, respectively) (j), modelled lysocline depth (k), deep-ocean Ωcalcite saturation (l), the modelled mean δ7Lisw offset by a fractionation factor (3–5‰, dark grey band; 2–6‰, light grey band) (m), the modelled weathering intensity through time (n), the contribution of rivers versus the combined sinks to the δ7Lisw signature (o) and the modelled 187Os/188Osinitial of seawater (p). In all panels (apart from e, j and m) the black line is the model average and the grey band denotes ±1σ. In m and p, the blue line and band are from Fig. 2. ALK, ocean alkalinity.

