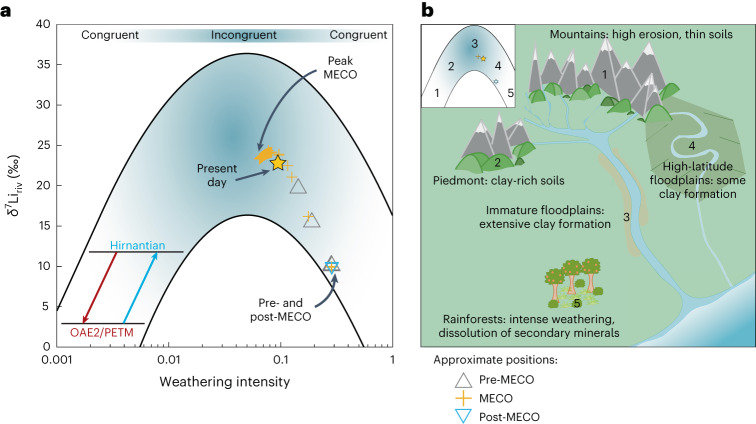
Fig. 4. Possible changes to the Earth system as inferred by δ7Li data and model results.
a, The modern-day relationship between W/D and δ7Liriv (the boomerang shape), with which our modelled average W/D and δ7Liriv results from Scenario 8 are compared, as well as those inferred from the modelling of other climatic events (where the W/D and δ7Liriv data decline for Oceanic Anoxic Event 2 (OAE2) and the PETM (red arrow) but increase for the Hirnantian glaciation (blue arrow)); the present-day global average is also shown21,29,30,35,36. b, The inset shows the pre- and post-MECO conditions (grey and blue triangles near position 4), the peak MECO conditions (yellow cross near position 3) and the present-day conditions (yellow star) and how they correspond to the different surface environments (main image) that affect δ7Liriv values30.

