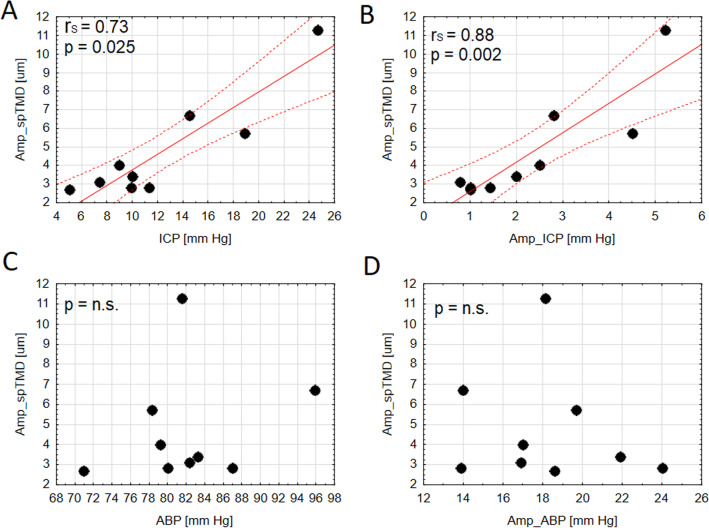
Fig. 4.
The correlation plots for the spectral amplitude of spontaneous tympanic membrane displacement (spTMD) and A mean intracranial pressure (ICP), B spectral amplitude of intracranial pressure (Amp_ICP), C arterial blood pressure (ABP), and D spectral amplitude of ABP (Amp_ABP). The regression line (solid line) and 95% of predictor limits (dashed lines) are shown in Figures A–B; rs — nonparametric Spearman correlation coefficient

