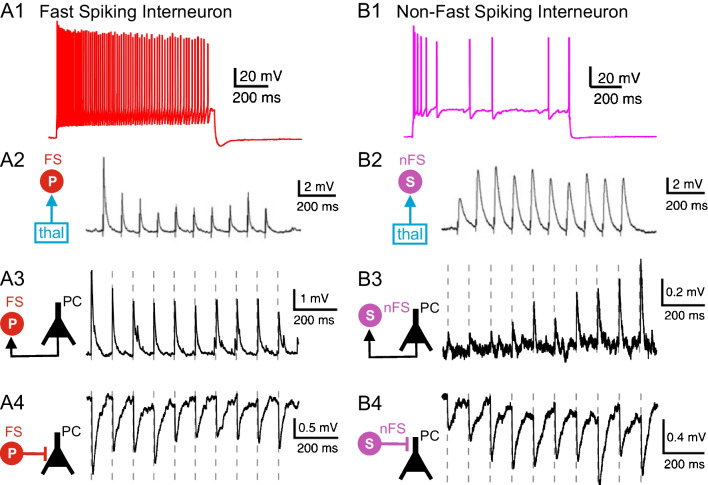
Fig. 3.
Firing pattern (upper row) and functional synaptic connectivity (rows 2–4) of a fast spiking parvalbumin expressing interneuron (A) and a non-fast spiking somatostatin expressing interneuron (B). Ten stimuli were delivered at 10 Hz to characterize strength and short-term dynamics of thalamocortical (row 2) and intracortical (rows 3 and 4) synaptic connections (see schematic connectivity diagrams to the left). Note synaptic depression in A2-4 versus facilitation in B2-4. Reproduced with permission from Feldmeyer et al. [5]. A2 and B2 reproduced from Tan et al. [20], copyright (2008) National Academy of Sciences

