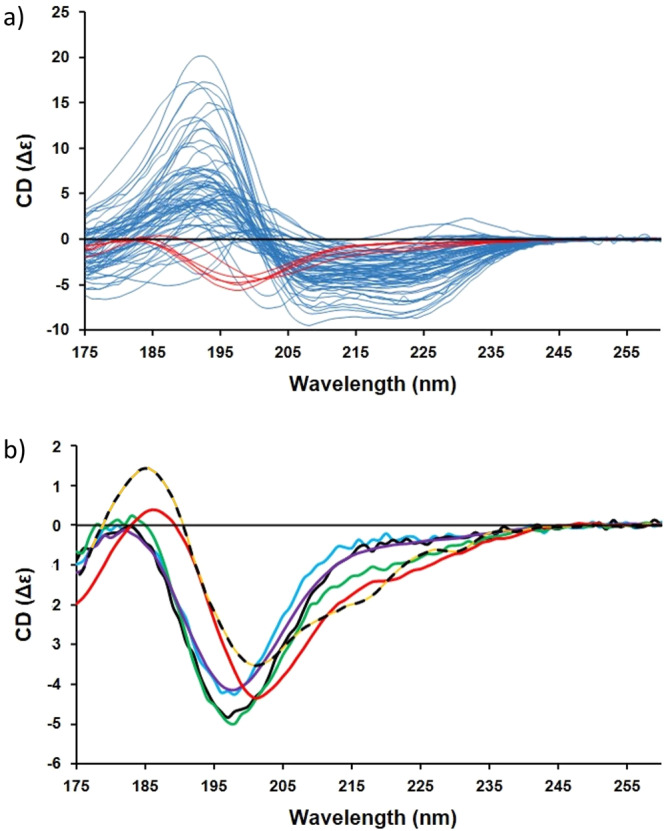
Fig. 1. CD spectra associated with the IDP175 reference dataset.

In (a), the complete IDP175 dataset where the new IDP spectra (listed in Supplementary Table S1 (top)) are shown in red whilst the spectra of the SP1758 proteins (listed in Supplementary Table S2) are shown in pale blue. The new IDP spectra of the IDP175 dataset in (b) are of MEG-1433 (purple), HASPA30 (blue), HASPB30 (black), TARP28 (green), and casein28 (red). For comparison, the dotted line is the spectrum of alpha-chymotrypsinogen (not included in the IDP reference dataset), which contains a highly-twisted right-handed beta-sheet, illustrating the similarity of this type of spectrum (designated “β2”) to the spectra of the IDPs.
