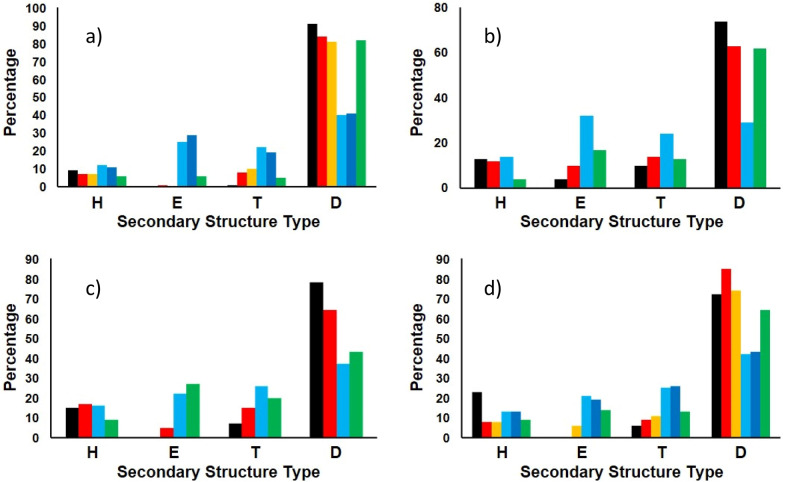
Fig. 3. Secondary structure analyses of the IDPs in the test set using DichroIDP in conjunction with various reference datasets mentioned in the text compared with AlphaFold2 predictions.
The proteins are: (a) osteopontin; (b) Sic136; (c) amelogenin37, and (d) ΒB1 C-terminus35. Secondary structures are indicated as: H=Helix (using “Dictionary of Secondary Structure of Proteins” (DSSP)23 assignments H + G + I). E= beta strand (DSSP E). T= Turn (DSSP T + S). D=disordered (DSSP B + O). For each secondary structure type, the coloured bars show the % of each structure predicted from their CD spectra using the following datasets: (red) IDP175t, (yellow) IDP175, (light blue) SP175t, (dark blue) SP1758, (green) CDPro4210. These are compared to AlphaFold221 predictions depicted in black in each panel. Sic1 and amelogenin were only analysed using the datasets IDP175t, SP175t and CDPro42 because their data had low wavelength cutoffs above 175 nm. Protein details are listed in Supplementary Table S1 (bottom).

