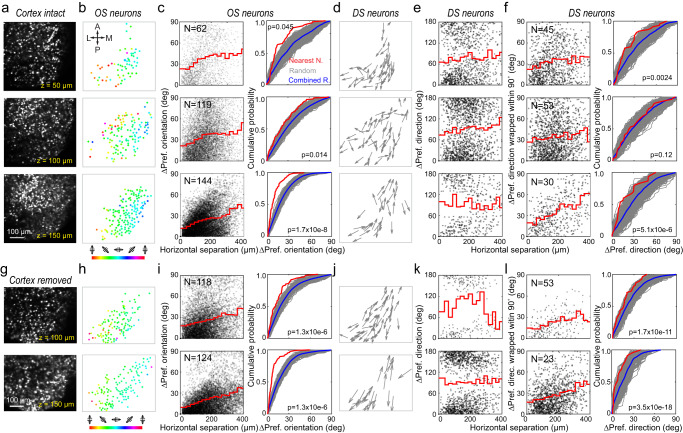
Fig. 3. Stimulus edge leads to orientation and direction columns in both cortex-intact and cortex-removed mice.
a sSC neurons expressing nuclear-targeted GCaMP6s at different depths in a cortex-intact mouse. b OS neurons mapped to the edge of 80° circular drifting gratings, color-coded by their preferred orientation. c Left: Horizontal separation for pairs of OS neurons versus difference in their preferred orientations (red curve: averages of 25-µm-wide bins). Right: Cumulative distributions of preferred orientation difference between nearest neighbors (red curve), randomly selected neuron pairs (1000 repeats, gray curves), and the average of random distributions (blue curve). p value: two-sample Kolmogorov–Smirnov test between red and blue curves. d DS neurons with their preferred directions of motion indicated by arrows. e Horizontal separation for pairs of DS neurons versus difference in their preferred directions. f Left: Horizontal separation for pairs of DS neurons versus difference in their preferred directions wrapped to (0, 90°); Right: same analysis as in (c). Representative result from five mice. g–l Same as (a, b, c, d, e, f), respectively, but acquired from a mouse with overlaying cortex removed. Representative result from three mice. Statistical tests were two-sided.

