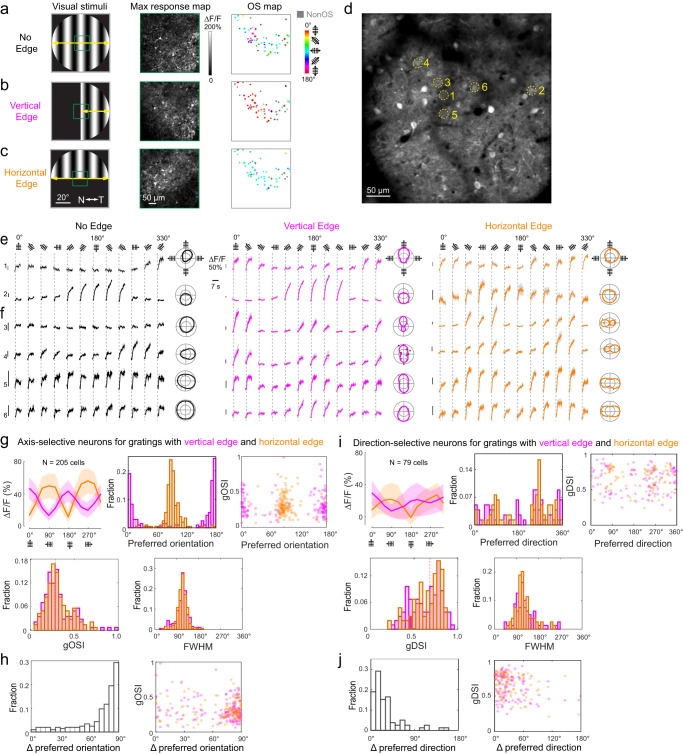
Fig. 4. sSC neurons change their orientation selectivity in response to the presence of grating edges of distinct orientations.
Maximal response and OS maps for example SC neurons whose receptive field mapped to screen center, where drifting gratings (a) without a central edge, (b) with a vertical edge, or (c) with a horizontal edge were presented. N and T nasal and temporal visual field directions. d Zoomed-in view of neurons either (e) maintaining or (f) switching their preferred orientation in response to grating edges through their receptive fields. Representative results reproduced in N = 6 mice. For axis-selective neurons in response to gratings with vertical or horizontal edge: g (Left to right, top to bottom) average calcium response ΔF/F, preferred orientation distribution, preferred orientation versus gOSI, and their OSI and FWHM distributions; h Change in preferred orientation for individual neurons and change in preferred orientation versus gOSI; 205 neurons from six mice. For direction-selective neurons in response to gratings with vertical or horizontal edge: i (Left to right, top to bottom) average calcium response ΔF/F, preferred direction distribution, preferred direction versus gDSI, and their DSI and FWHM distributions; j Change in preferred direction for individual neurons and change in preferred direction versus gDSI; 79 neurons from six mice. Shaded error bands: e, f s.e.m.; g, i s.d.

