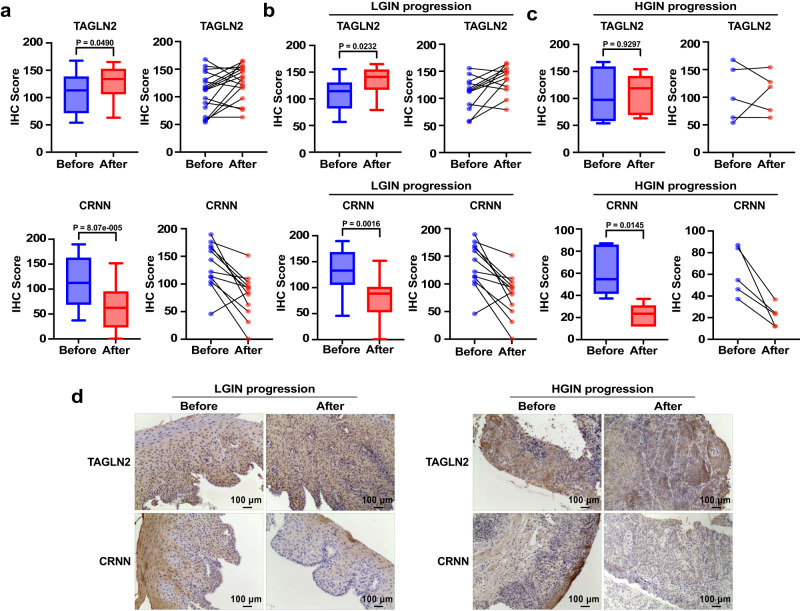
Fig. 6. Verification of the association between candidate genes and ESCC progression.
a An analysis of the IHC scores of TAGLN2 and CRNN was conducted on all paired progressed samples (including LGIN progression samples (n = 12) and HGIN progression samples (n = 5) biologically independent samples). b Statistics of the IHC scores of TAGLN2 and CRNN in paired LGIN progression (n = 12) tissue. c Statistics of the IHC scores of TAGLN2 and CRNN in paired HGIN progression samples (n = 5) tissue. d Representative images of TAGLN2 and CRNN in paired LGIN progression and HGIN progression samples (Scale bar, 100 μm). In the box plots (a, b, c), the boxplot shows the median (central line), upper and lower quartiles (box limits), and min to max range (whiskers) analyzed by a two-tailed paired t-test. Source data are provided as a Source Data file.

