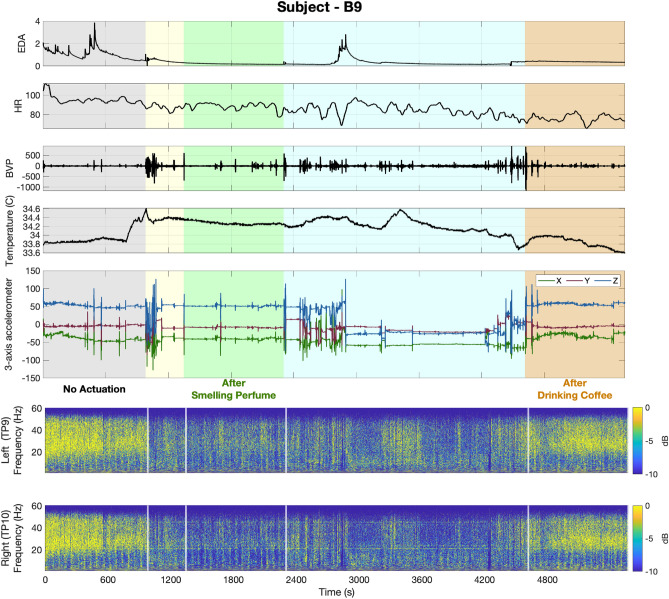
Figure 2.
Raw physiological data collected via Empatica E4 Wristband and Muse Headband (Subject—B9, Experiment 2). In the top panel, sub-panels in turn represent the EDA, HR, BVP, body temperature, and 3-axis accelerometer data. The grey, green, and rust background colors in turn represent the results associated with no actuation, smelling perfume, and drinking coffee sessions, respectively. Yellow and blue background colors are associated with rest time periods for smelling perfume and drinking coffee, respectively. Sub-panels in the bottom panel depict spectrogram representations of EEG signals recorded from the left and right temporoparietal areas of the brain (i.e., TP9 and TP10). White vertical lines separate the memory tasks from rest times.

