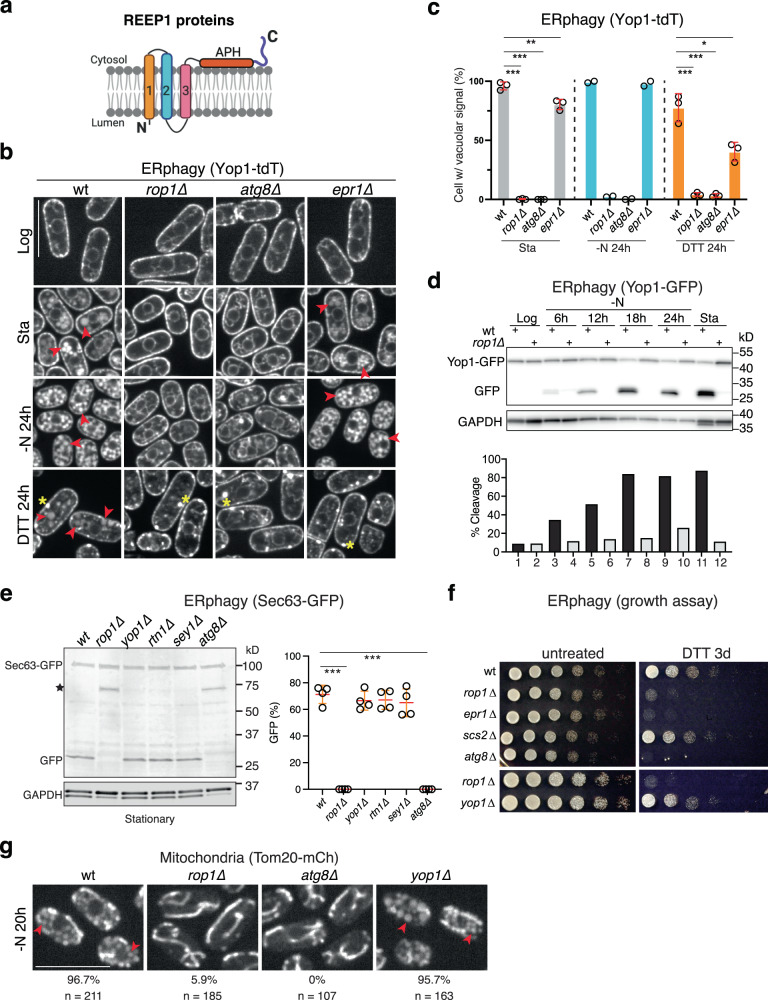
Fig. 1. S. pombe Rop1 is required for autophagy of organelles.
a Membrane topology of Rop1 and other REEP1 family proteins. Transmembrane (TM) segments are numbered. APH, amphipathic helix. b ERphagy in S. pombe was tested with a tdTomato fusion of the ER protein Yop1 (Yop1-tdT) expressed at endogenous levels in wild-type (wt) cells or cells lacking the indicated proteins. Cells were imaged by fluorescence microscopy at logarithmic (Log) or stationary (Sta) growth phase, after nitrogen starvation for 24 h (-N 24 h), or after treatment with DTT for 24 h (DTT 24 h). Scale bar, 5 µm. Red arrowheads point to vacuoles and yellow stars to Yop1 aggregates. c Quantification of experiments in (b). Shown is the percentage of cells with vacuolar fluorescence. The circles refer to three individual experiments. Also shown are means and standard deviations (SD). *, **, and *** indicate significant differences with p-values < 0.1, 0.01, and 0.001, calculated from two-tailed Student’s t tests. The exact p-values are listed in the Source Data file. d Cleavage of GFP-tagged Yop1 (Yop1-GFP) was tested in wt or rop1Δ cells grown at Log or Sta phase or deprived of nitrogen (-N) for different time periods. Lysates were analyzed by SDS-PAGE and immunoblotting with GFP antibodies. Blotting with GAPDH antibodies served as loading control. The lower panel shows the percentage of Yop1-GFP cleavage. e As in (d), but with the GFP-tagged ER marker Sec63 (Sec63-GFP) tested in wt and mutant strains. The star indicates a cleavage product not caused by ERphagy. The right panel shows quantification of Sec63-GFP cleavage in four experiments, performed as in (c). f wt or mutant cells were treated with DTT for 3 days and plated after serial dilution. Controls were performed with untreated cells. g As in (b), but for the mitochondrial protein Tom20 tagged with mCherry (Tom20-mCh). The percentage of cells with vacuolar fluorescence and the number of cells analyzed are given below the images. Scale bar, 10 µm.

